

Cardano Price Forecast: Bears tighten grip as downside risks grow
- Cardano price slips below $0.250 on Monday, keeping a bearish tone after declining more than 15% over the past two weeks.
- Derivatives metrics turn bearish, with funding rates turning negative and short bets rising.
- The technical outlook suggests increasing downside risk, with bearish momentum strengthening and pointing to a further correction.
Cardano (ADA) remains bearish, trading below $0.250 on Monday after falling by more than 15% over the past two weeks. Weakening derivatives metrics, alongside a deteriorating technical outlook, suggest the correction could extend further.

Derivatives traders turn bearish
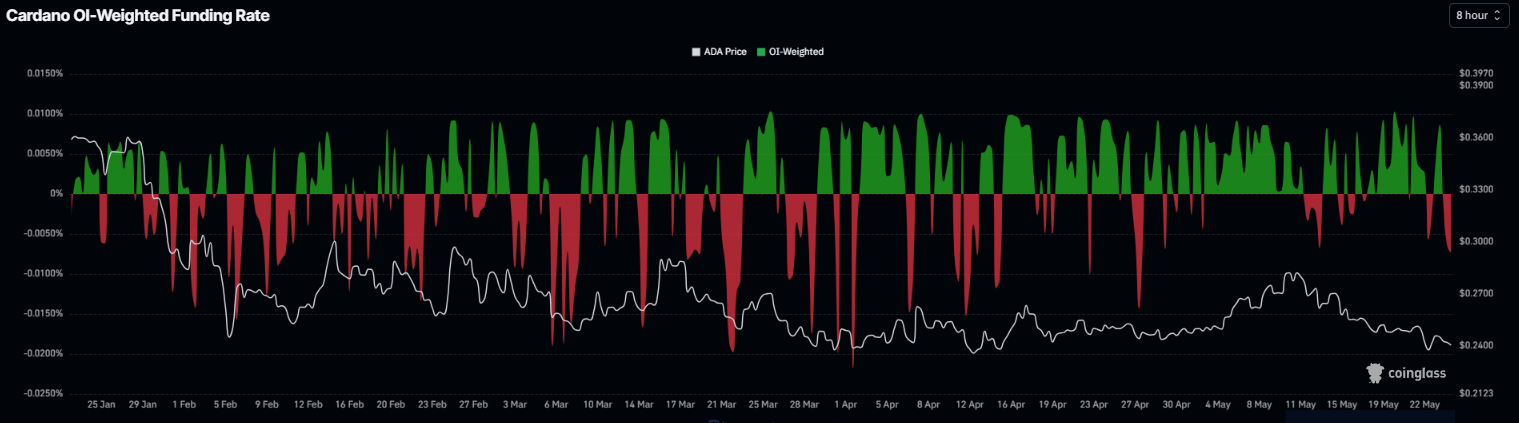
Cardano’s derivatives data supports a bearish bias. CoinGlass funding rates turned negative on Sunday, reading -0.0078% on Monday. These negative rates indicate that longs are paying shorts, suggesting bearish sentiment.
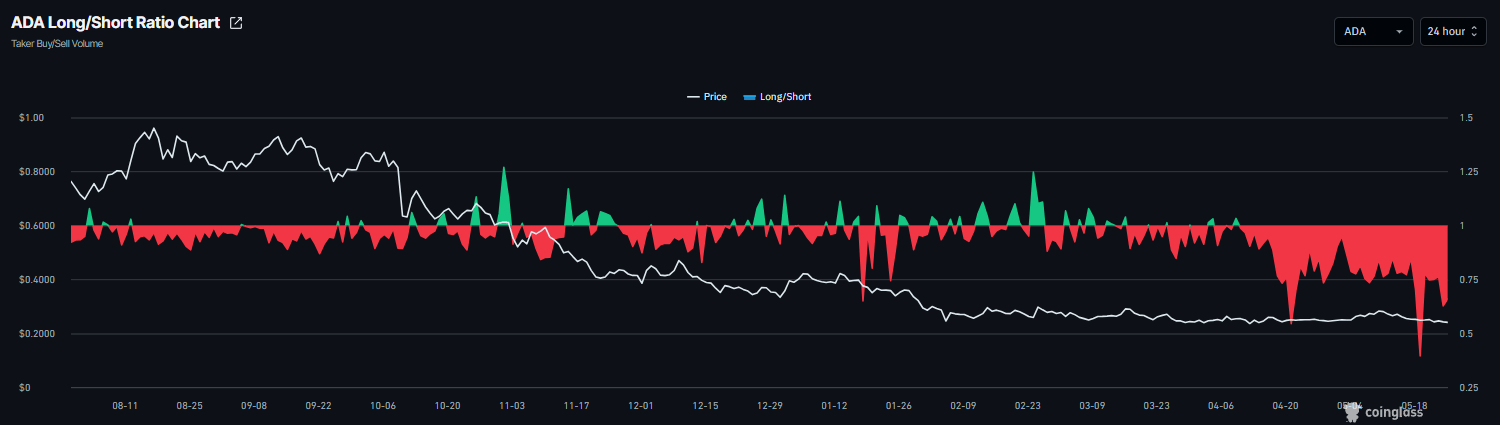
In addition, Coinglass’s long-to-short ratio for ADA reads 0.65 on Monday, nearing the lowest level over a month. The ratio being below one, indicates bearish sentiment, as traders are betting the asset’s price will fall.
Cardano Price Forecast: Bears in control of momentum
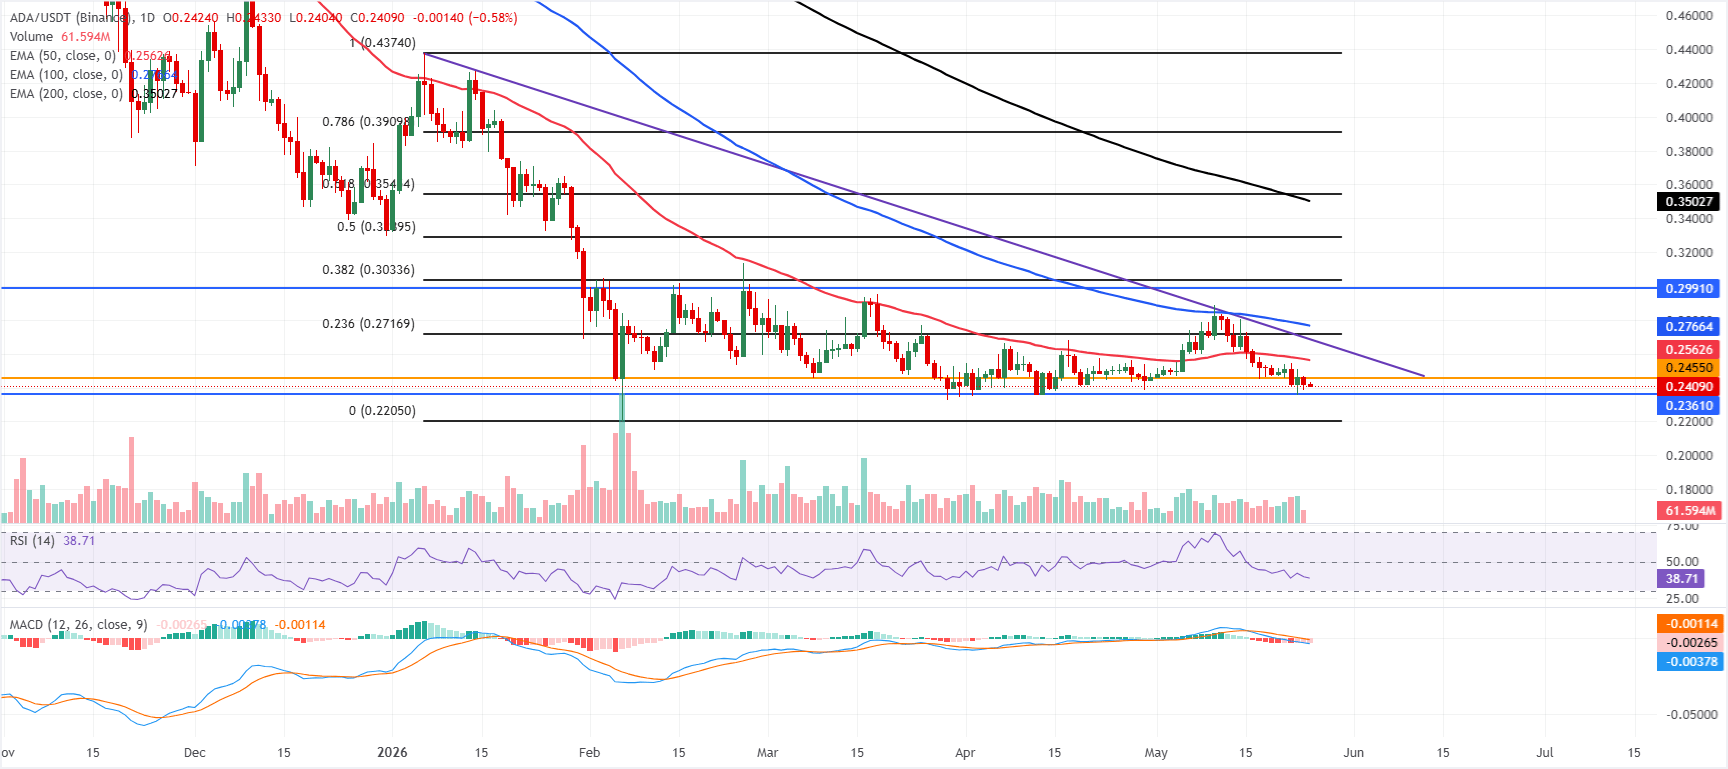
Cardano price trades below $0.250 on Monday, maintaining a bearish near-term tone as it remains below the 50-day, 100-day, and 200-day Exponential Moving Averages (EMAs), clustered between roughly $0.256 and $0.350.
The failed break of the downward resistance trendline, with its break reference near $0.268 still overhead, reinforces a capped structure, while the Relative Strength Index (RSI) on the daily chart slipping toward the high-30s and the Moving Average Convergence Divergence (MACD) remaining in negative territory both suggest weakening momentum rather than an imminent recovery.
On the topside, initial resistance emerges at the horizontal barrier around $0.245, ahead of the 50-day EMA near $0.256 and the trendline break zone at $0.268, with the 23.6% Fibonacci retracement at $0.271 and the 100-day EMA at $0.276 adding to a dense supply band above current levels.
On the downside, immediate support is seen at the horizontal level around $0.236; a clear break below this floor would expose the pair to further downside within the broader bearish structure defined by the higher Fibonacci retracement levels and the still descending long-term EMAs overhead.
(The technical analysis of this story was written with the help of an AI tool.)














