

Ethereum Price Forecast: Bulls reclaim dominance, but buying remains weak
Ethereum price today: $1,740
- Onchain activity indicates that bulls have returned to action at a modest pace.
- ETH ETFs posted four straight days of inflows, but volume stays weak.
- ETH is testing the 20-day EMA after a rejection at the 50-day EMA near $1,800.
Ethereum (ETH) has slowly seen a return of bullish dominance over the past few days after a lengthy period of bearish pressure. However, buying pressure remains weak despite registering nearly a 10% gain since the beginning of the month.

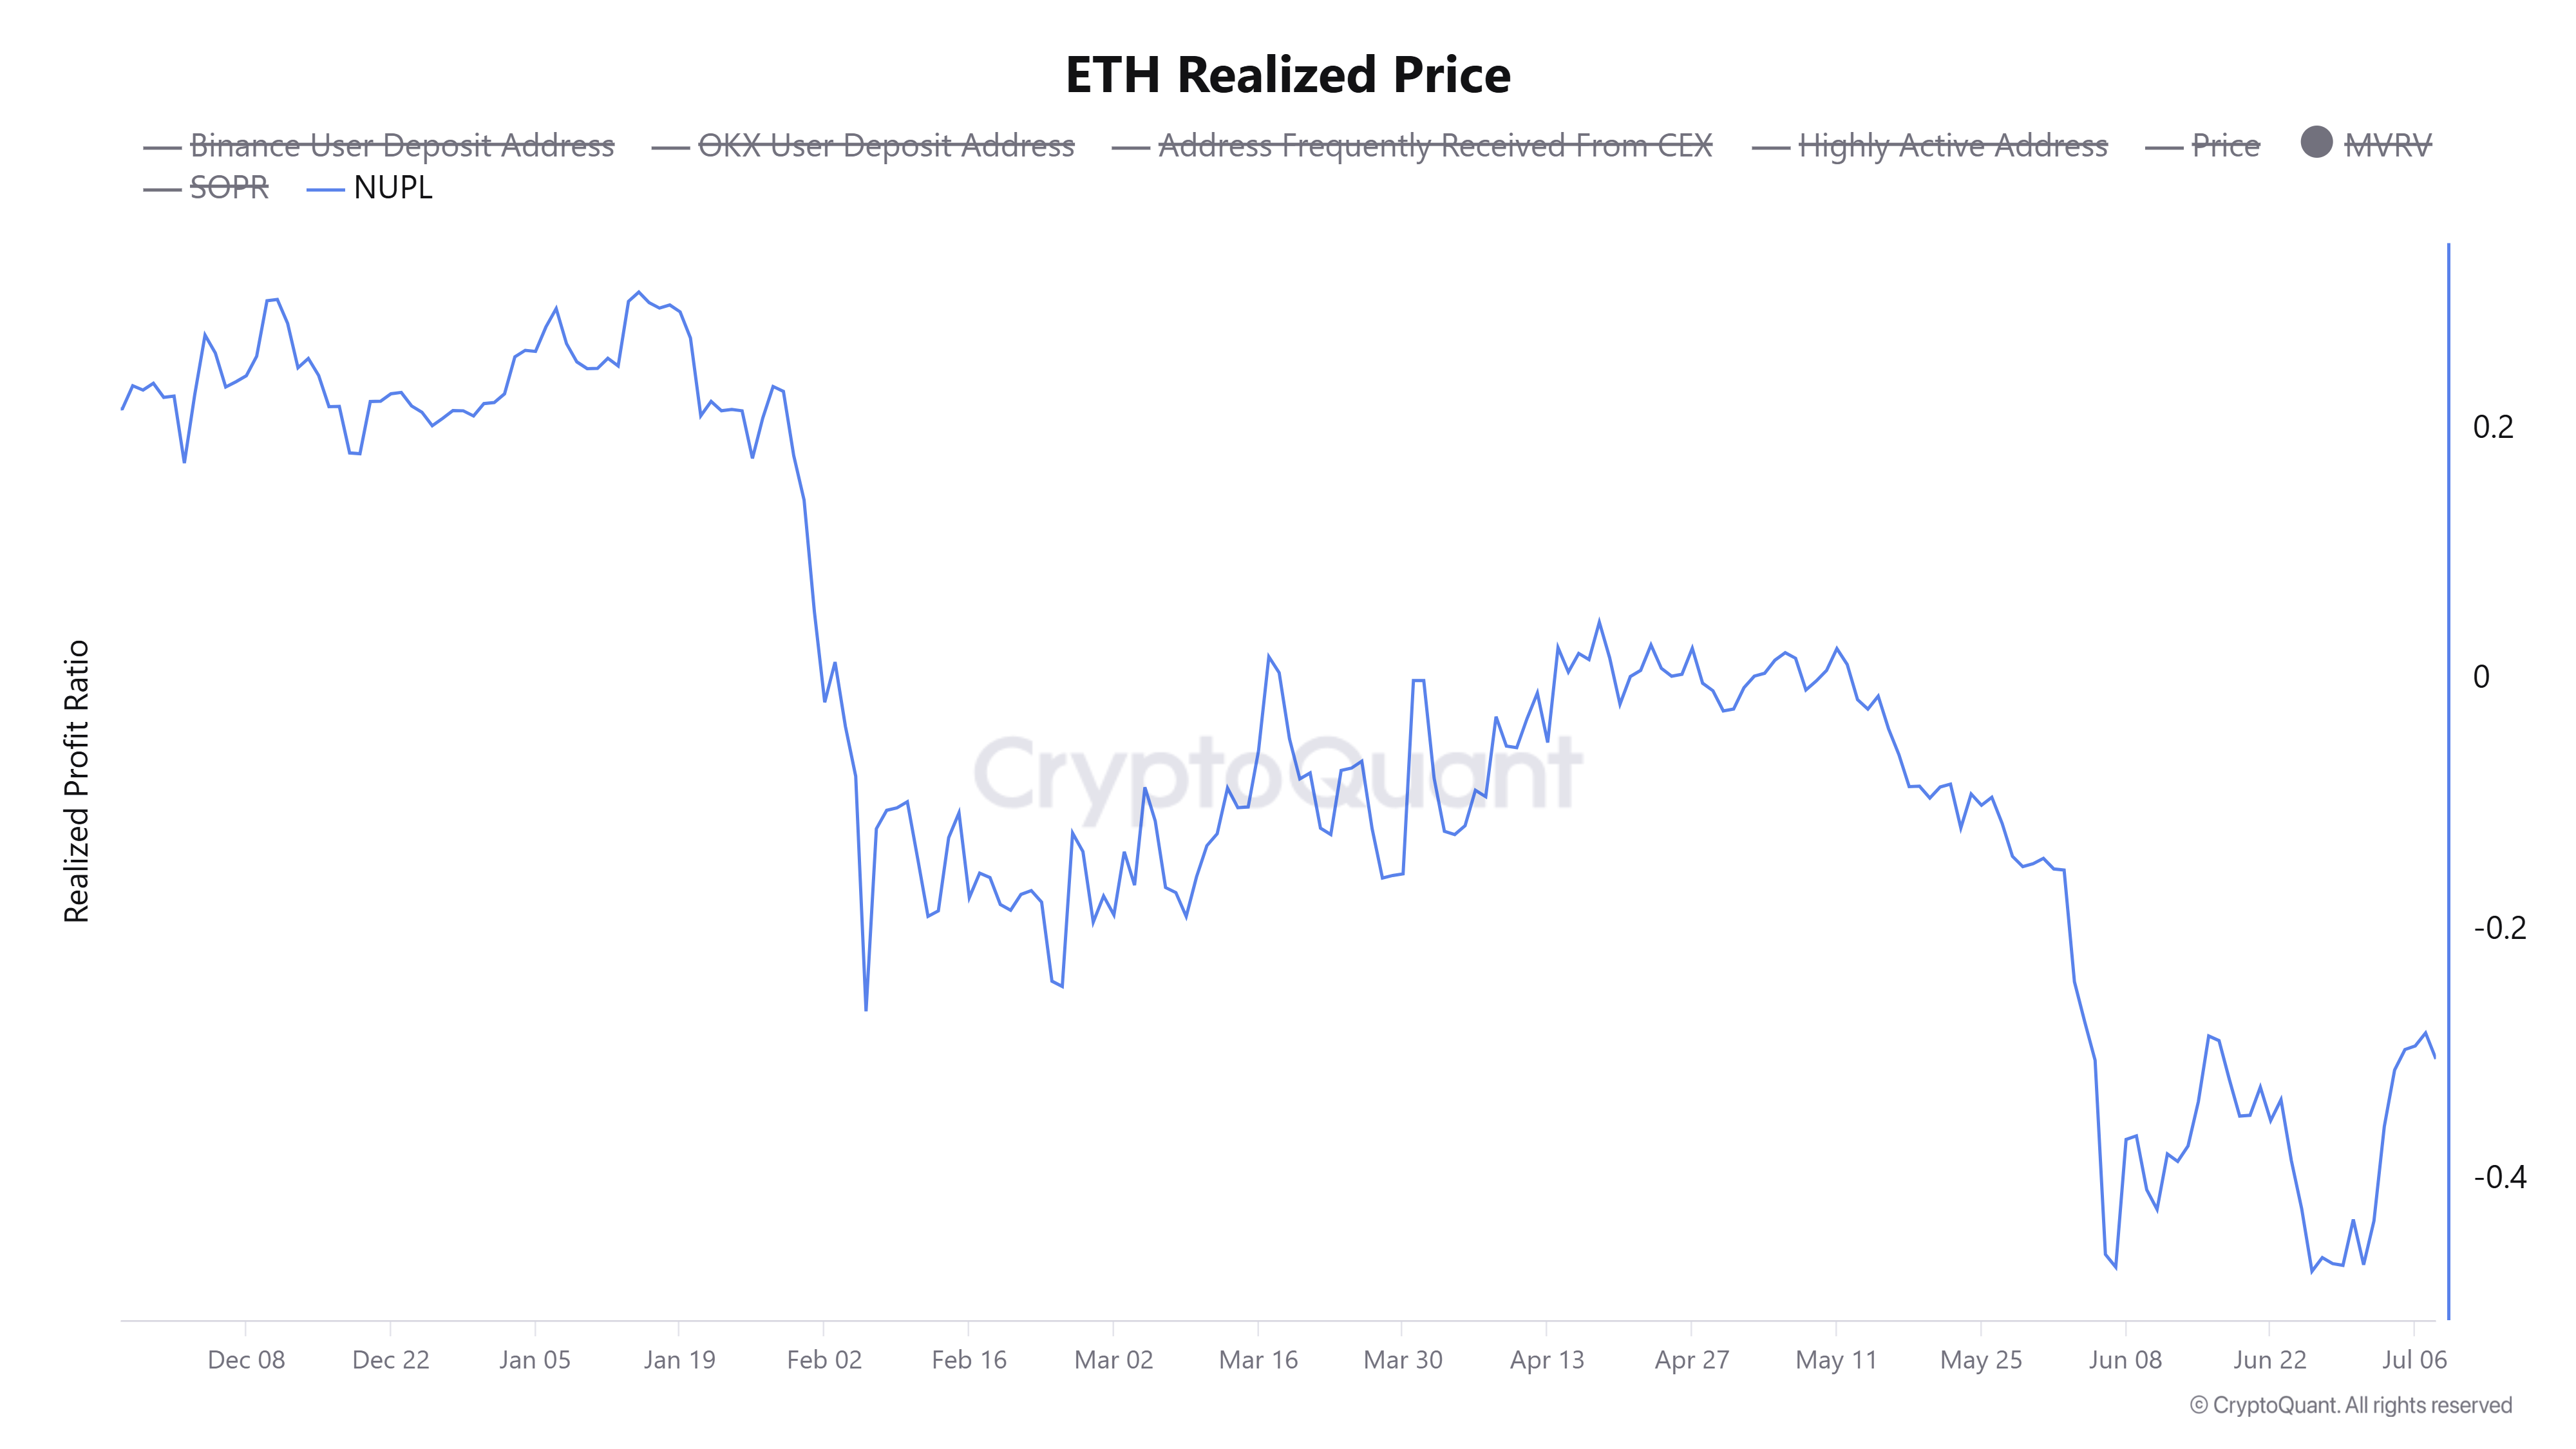
The Net Unrealized Profit/Loss (NUPL) metric has eased from -0.46 to -0.30, indicating that while recent price gains have reduced investors' losses, their holdings remain underwater. A larger price gain, fueled by strong buying pressure, will be needed to lift those holdings back into profit territory.
Whales or wallets with a balance of 10K-100K ETH saw inflows of roughly 100K ETH over the past week, but their balance remains largely unchanged on the three-week timeframe. On the other hand, retail wallets holding 100-1K and 1K-10K ETH saw negligible changes in their balances, with their holdings remaining largely unchanged over the period.
Meanwhile, US spot ETH exchange-traded funds (ETFs) have posted four consecutive days of net inflows for the first time since early May, per SoSoValue data. The inflows across the four days totaled $91.5 million, not strong enough to spark a major upward price surge.
A similar move is observed in the Coinbase Premium Index, which measures the sentiment of US investors. The metric has retreated from a low of -0.169 to -0.076, indicating that while US demand has improved compared to previous weeks, it remains weak overall. Notably, the index hasn't spent more than 50 days in positive territory since the beginning of the year.
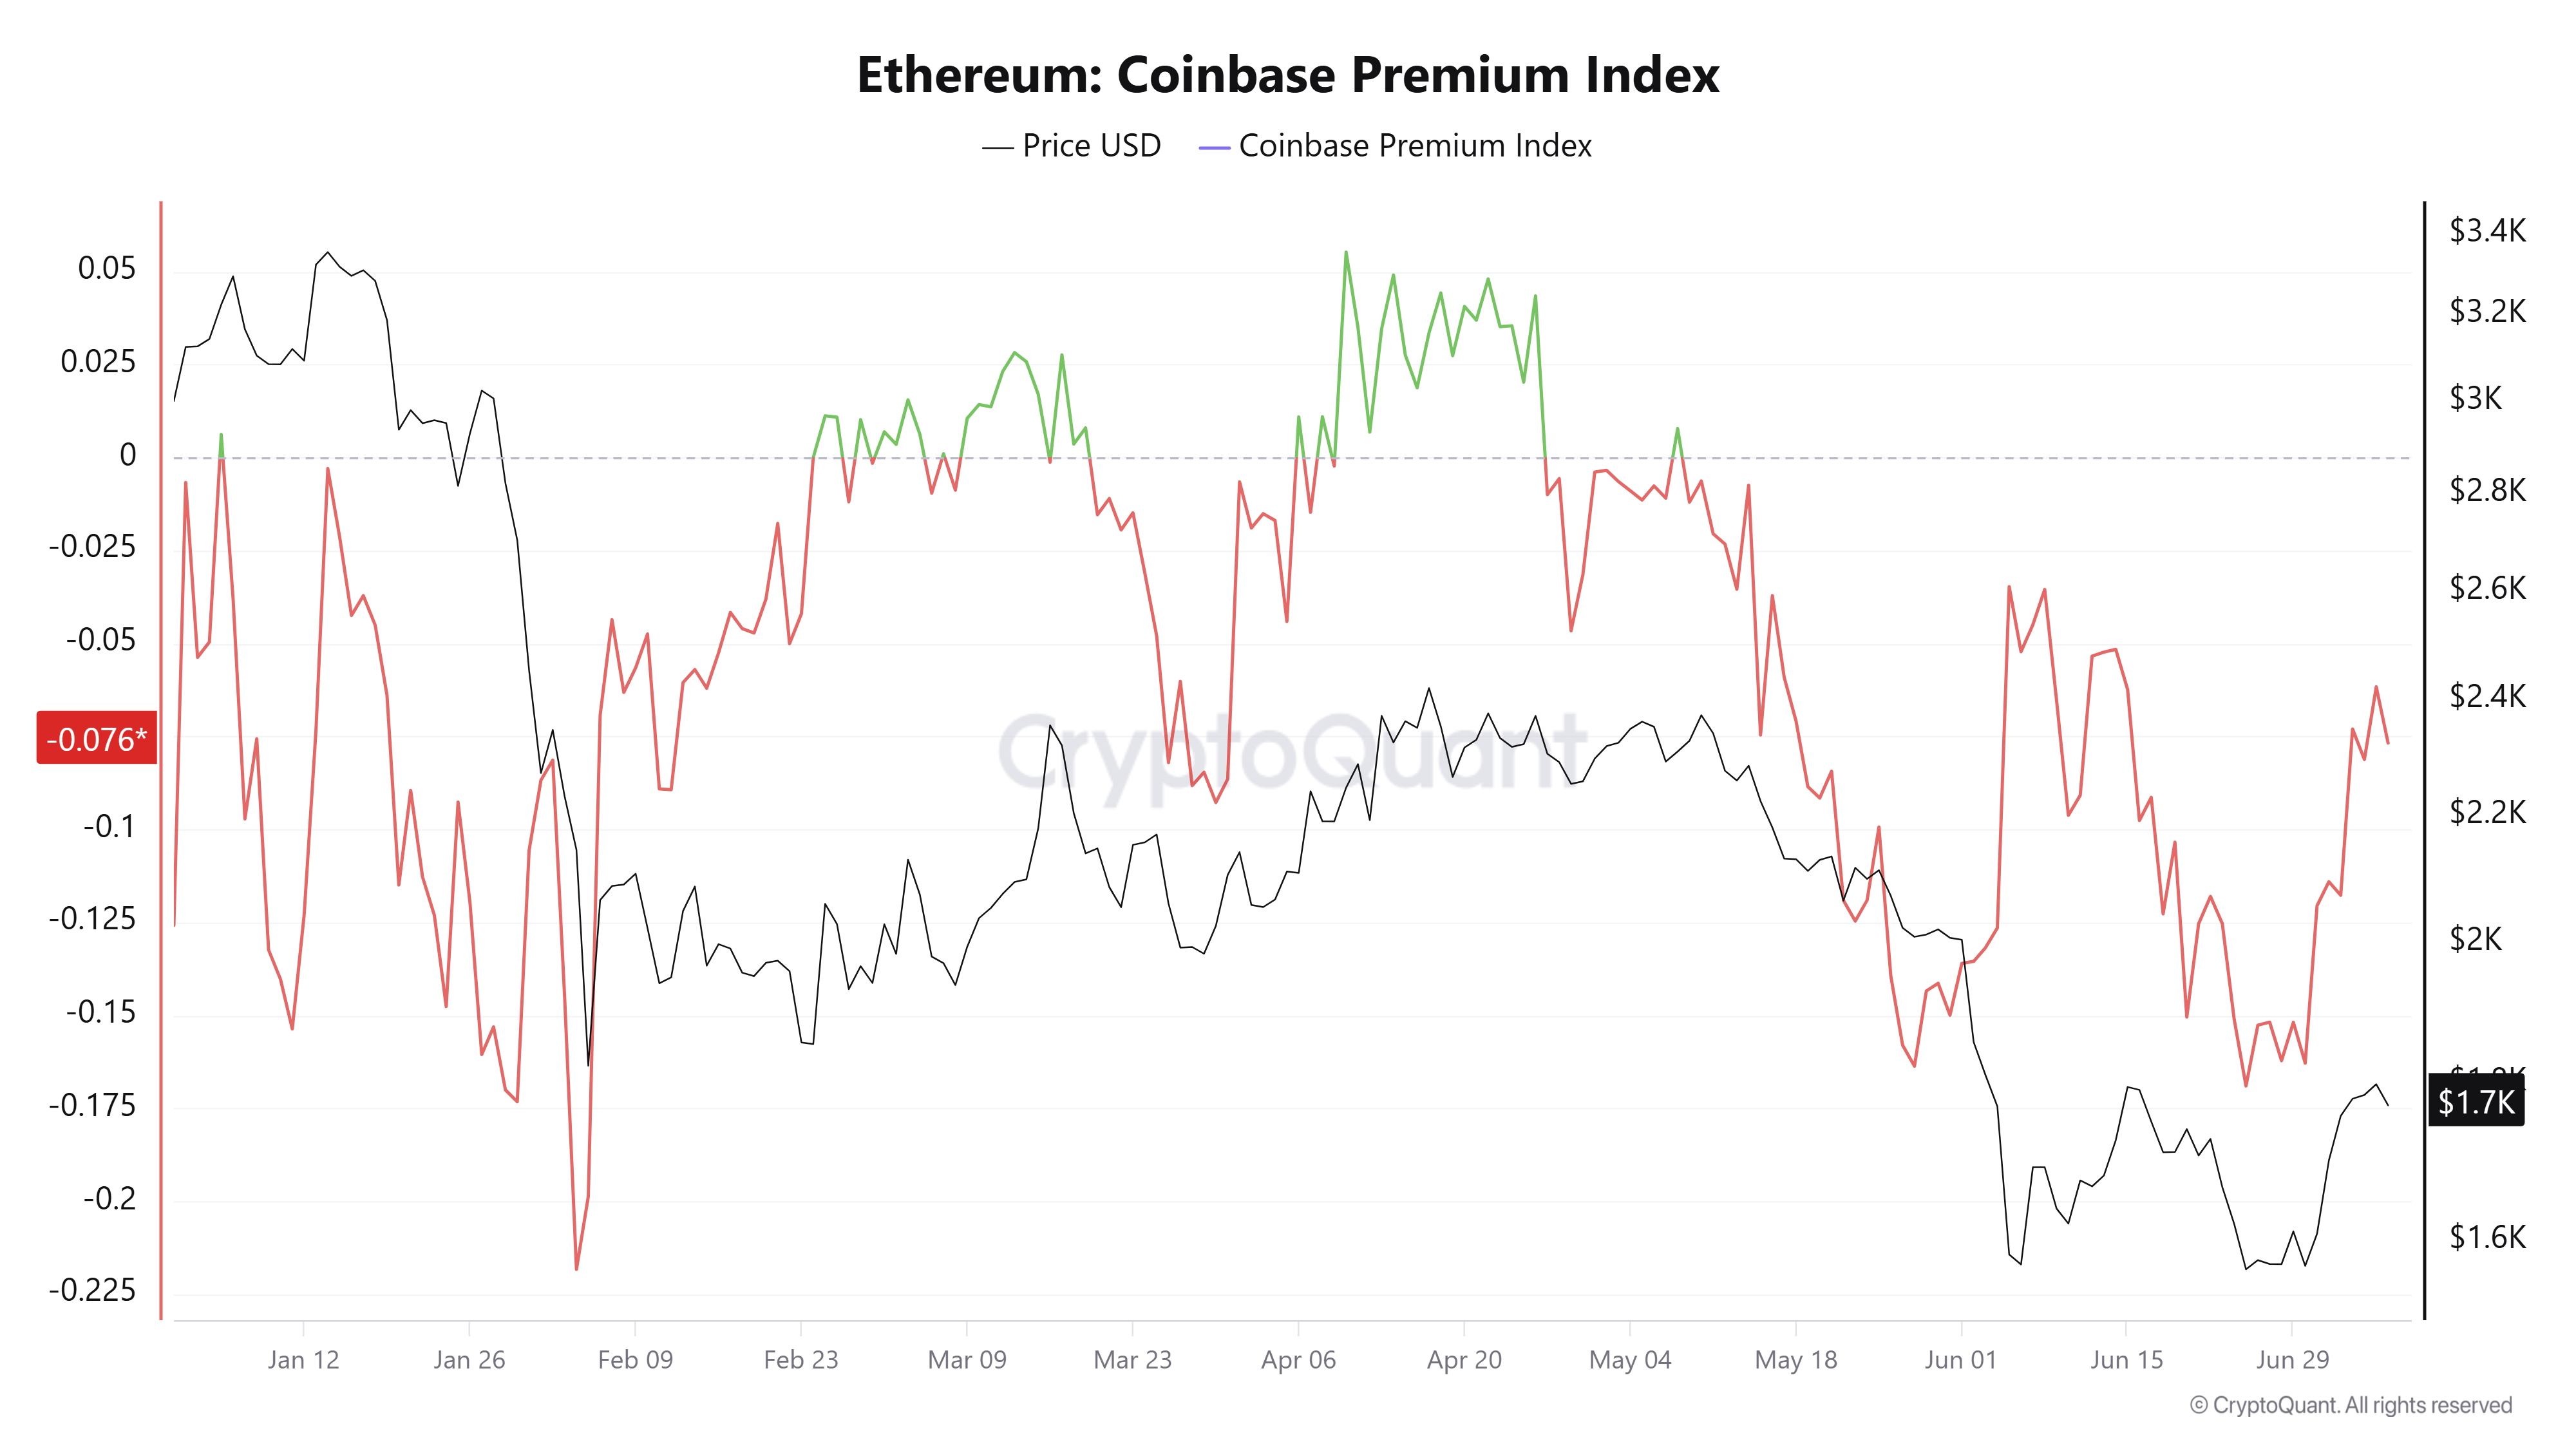
Historically, the Coinbase Premium Index and spot ETH ETF inflows have to stay elevated to spark a major upward price move.
On the derivatives side, open interest has remained flat over the past week, indicating caution among leveraged traders, who have yet to commit capital to the market despite recent price gains.
Ethereum Price Forecast: ETH tests 20-day EMA
Ethereum saw $61.6 million in liquidations over the past 24 hours, led by $51.5 million in long liquidations.
The move comes as ETH maintains a bearish near-term bias, holding below the 50- and 100-day Exponential Moving Averages (EMAs) at $1,803 and $1,965, respectively. Price is clinging just above the 20-day EMA support at $1,714. Momentum shows easing buying pressure with the Relative Strength Index (RSI) and Stochastic Oscillator (Stoch) declining toward 51 and 70, respectively.
On the downside, the 20-day EMA at $1,714 offers immediate support, ahead of more substantial floors at $1,524 and $1,404, while a deeper slide would expose the longer-term base near $1,155.
On the topside, initial resistance is the cluster formed by the 50-day EMA at $1,803 and the $1,806 horizontal line. A sustained break above this area would be needed to open the way toward $1,909 and the 100-day EMA at $1,965, with higher hurdles appearing at $2,018 and $2,107.
(The technical analysis of this story was written with the help of an AI tool. Know more.)














