
News & AnalysisCareer

A 0.2% fall leaves the Euro (EUR) trading near 1.1138 against the US Dollar (USD) in Wednesday’s European session. Weighing on EUR/USD is a stronger US Dollar, supported by concerns that the Federal Reserve (Fed) could embark on an aggressive monetary tightening cycle to curb persistently accelerating inflationary pressures.

Today’s percentage movements in the US Dollar (USD) against the major currencies listed are set out below. Its strongest performance was against the Swiss Franc.
| USD | EUR | GBP | JPY | CAD | AUD | NZD | CHF | |
|---|---|---|---|---|---|---|---|---|
| USD | 0.22% | 0.21% | 0.16% | 0.23% | -0.03% | 0.24% | 0.47% | |
| EUR | -0.22% | -0.01% | -0.05% | 0.01% | -0.26% | 0.02% | 0.24% | |
| GBP | -0.21% | 0.01% | -0.04% | 0.02% | -0.24% | 0.04% | 0.26% | |
| JPY | -0.16% | 0.05% | 0.04% | 0.07% | -0.19% | 0.07% | 0.30% | |
| CAD | -0.23% | -0.01% | -0.02% | -0.07% | -0.26% | 0.00% | 0.23% | |
| AUD | 0.03% | 0.26% | 0.24% | 0.19% | 0.26% | 0.28% | 0.50% | |
| NZD | -0.24% | -0.02% | -0.04% | -0.07% | -0.01% | -0.28% | 0.23% | |
| CHF | -0.47% | -0.24% | -0.26% | -0.30% | -0.23% | -0.50% | -0.23% |
Percentage movements between the major currencies are displayed in the heat map. Select the base currency in the left-hand column and the quote currency in the top row. Selecting the US Dollar on the left and following that row across to the Japanese Yen, for instance, gives the percentage change in USD (base)/JPY (quote).
At 102.51, the US Dollar Index (DXY) reaches a fresh high of almost four weeks during European trading. The index measures the Greenback against six major currencies.
October’s stronger-than-forecast United States (US) Consumer Price Index (CPI) release has led financial markets to begin pricing in a December interest rate increase of 50 basis points (bps), according to the CME FedWatch tool. The probability nevertheless remains modest, at around 13.5%.
In a note, Deutsche Bank strategists observed that the “monthly core CPI print for October was above consensus at +0.30% (vs. +0.2% expected).” The bank went on to say that “it was the third consecutive month with core CPI at +0.3%, and if you take those three months together, the annualised pace for core CPI is running at +3.75%.” It concluded that “that’s the fastest pace on that measure since April 2024, so it made it increasingly difficult to dismiss this as a blip.”
Turning to the headline figures, the bank also emphasised that “meanwhile, the headline CPI numbers were faster still, with monthly headline CPI at +0.35% (vs. +0.3% expected), with the 3-month annualised pace at +5.72%.”
The expected leadership transition at the European Central Bank (ECB), meanwhile, is likely to leave the Euro highly volatile.
In Rabobank’s assessment, Dutch central banker Klaas Knot used an interview with the Financial Times to highlight the Governing Council’s record in tackling crises. Knot, a leading contender to succeed ECB President Christine Lagarde, stressed that “If circumstances require it, we will not hesitate to take action.” Rather than signalling a return to “50bps rate hikes due to geopolitically driven inflation,” analysts say his comments addressed the opposite possibility: a future European crisis “of a different nature.” Against that backdrop, Rabobank notes that Knot “would not rule out developing another, more tailored instrument,” pointing to the possibility of new policy tools if conditions worsen again.
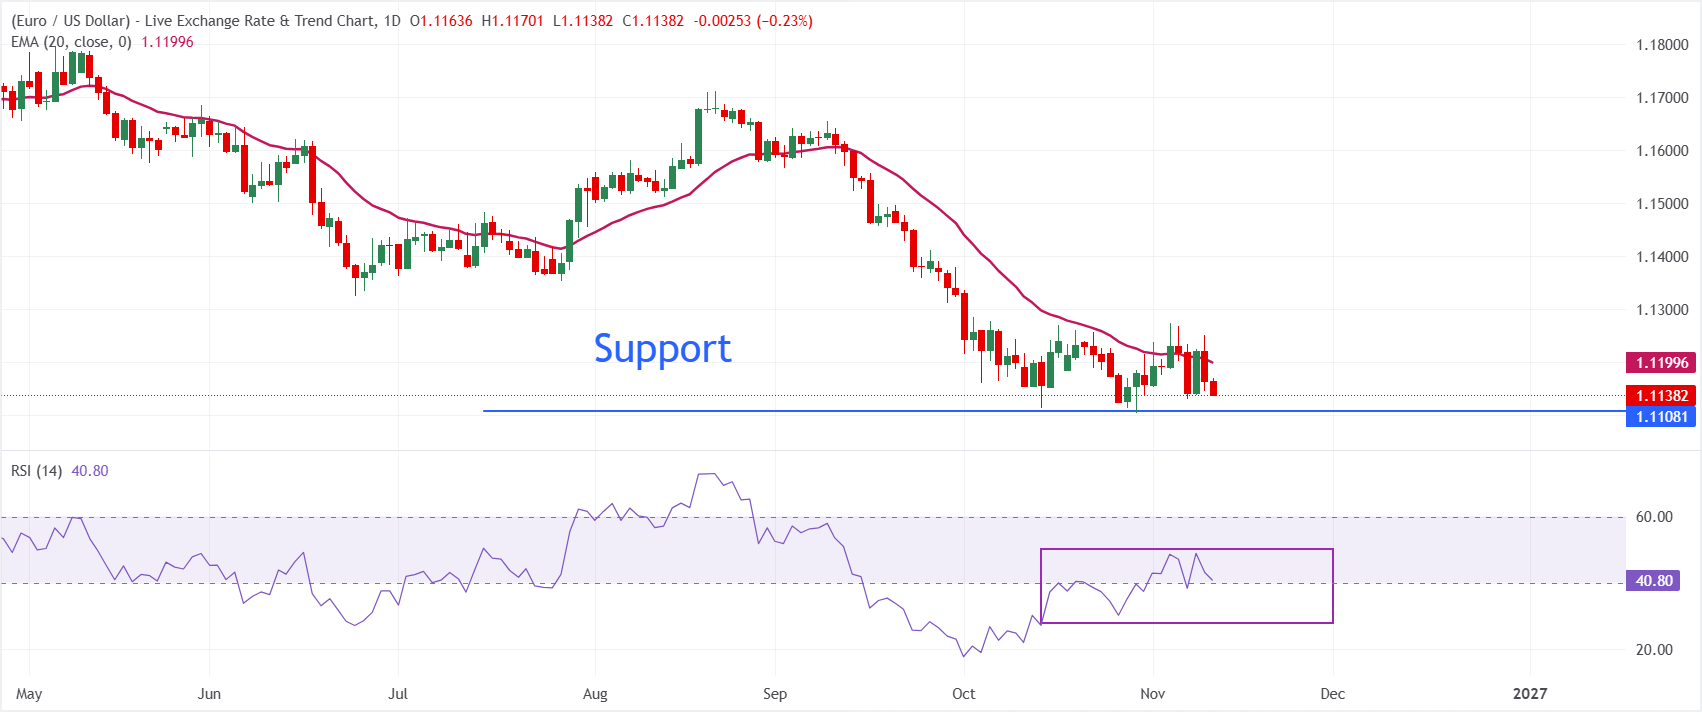
Trading at 1.1138 on the daily chart, EUR/USD retains a mildly bearish bias. The pair remains below recent closing levels and just beneath its 20-day exponential moving average (EMA) of 1.1200, now a nearby obstacle.
At around 41, the 14-day Relative Strength Index (RSI) remains below the neutral threshold of 50. This suggests that selling pressure continues to dominate, although the oversold conditions evident earlier in the month have subsided.
Initial support lies at the recent low of 1.1104, with a breach leaving 1.1000 exposed. A rebound towards the 20-day EMA support area near 1.1200 would offer the first indication of stabilisation. To temper the prevailing bearish bias and allow a wider corrective recovery, the pair would need to sustain trading above that level.
(The technical analysis of this story was written with the help of an AI tool. Know more.)
The Consumer Price Index (CPI) tracks inflationary or deflationary trends by regularly adding up the prices of a representative basket of goods and services. Compiled monthly, the figures are published by the US Department of Labor Statistics. The MoM reading compares goods prices in the reference month with those in the preceding month. By omitting the food and energy components, which are considered more volatile, the CPI Ex Food & Energy provides a more accurate gauge of price pressures. A high reading is generally regarded as positive for the US Dollar (USD), whereas a low reading is viewed as negative.
Find out more.Latest release: Tue 10 November 2026 13:30
Release frequency: Monthly
Reported figure: 0.3%
Consensus forecast: 0.2%
Previous reading: 0.3%
Data source: US Bureau of Labor Statistics
Inflation should stand at around 2% year on year under the US Federal Reserve’s dual mandate to maintain price stability and maximum employment. Since the onset of the global pandemic, which continues to this day, price stability has become the weakest pillar of that mandate. Supply-chain difficulties and bottlenecks continue to push up price pressures, leaving the Consumer Price Index (CPI) at multi-decade highs. Having already acted to bring inflation under control, the Fed is expected to retain its aggressive stance for the foreseeable future.










The information provided on this website is of a general nature only and does not constitute personal financial advice. Before acting on any information on this website, you should consider the suitability of the information in relation to your objectives, financial situation and needs. Investing in CFDs and FX Margin Contracts carries significant risks and is not suitable for all investors. You may lose more than your initial deposit. You do not own, or have, any interest in the underlying asset. We recommend that you seek independent advice and ensure you fully understand the risks involved before trading. It is important that you read and consider the disclosure document before you acquire any product listed on the website. The information and advertisements offered on this website are not intended for use by any person in any country or jurisdiction where such use would be contrary to local laws and regulations. The Products and Services offered on this website are not intended for residents of the United States, Malaysia and Thailand.
TMGM is authorized and regulated in various jurisdictions.
Trademax Australia Limited, trading as TMGM, is regulated by the Australian Securities and Investments Commission (ASIC), AFSL no. 436416 and is located at Level 28, One International Tower, 100 Barangaroo Avenue, 2000 Sydney, NSW Australia.
Email: support@tmgm.com.au
Trademax Global Limited, trading as TMGM, is authorized and regulated by the Vanuatu Financial Services Commission (VFSC), registration number 40356 and registered at 1276, Kumul Highway, Port Vila, Vanuatu, Republic of Vanuatu.
Email: support@tmgm.com
Trademax Global Markets (SE) Limited, trading as TMGM, is authorized and regulated by the Financial Services Authority (FSA) of Seychelles, with license number SD224. The company is registered at Office No 13, Providence Estate ABIS Centre, Mahe, Seychelles.
Email: support@tmgm.com
Trademax Global Markets (International) Pty Ltd, trading as TMGM, is authorized and regulated by the Financial Services Commission, Mauritius (FSC) with license no. GB22201012, and registered at 33, Edith Cavell Street C/o IQ EQ Fund Services (Mauritius) Ltd Port Louis, 11324 Mauritius.
Email: support@tmgm.com
Copyright © TMGM. All rights reserved


