
News & AnalysisCareer

An over 8% rebound the previous day has been followed by further buying interest in Pi Network (PI) on Wednesday. Holding above $0.070, the PI token extends its recovery from oversold levels even as the broader market corrects. A sustained upward trend, however, requires Pi Network to clear the overhead trendline near $0.0740.

Ahead of its three-day ecosystem summit beginning on 17 November, Pi Network is showing signs of a recovery. YouTube broadcasts over the first two days will cover the developer platform, ecosystem initiatives and AI. A hackathon with a $200,000 prize pool will follow on the third day. The recovery suggests renewed social interest and potential demand from retail investors ahead of the next Pi event.
At $0.0723, Pi Network remains well below its 50-day and 200-day Exponential Moving Averages (EMAs), at roughly $0.0797 and $0.1081 respectively, maintaining the bearish bias.
A resistance trendline linking the highs of 20 June and 22 August, currently around $0.0740, continues to cap PI within a dominant long-term downtrend. Restoring a bullish trend would require a break above both that trendline around $0.0740 and the 50-day EMA at $0.0797. This would pave the way towards the psychological $0.1000 level.
At around 41, the Relative Strength Index (RSI) points to subdued rather than extreme bearish momentum, with momentum remaining weak overall. Meanwhile, the Moving Average Convergence Divergence (MACD) sits marginally in negative territory and below its signal line, supporting the view that downside pressure persists.
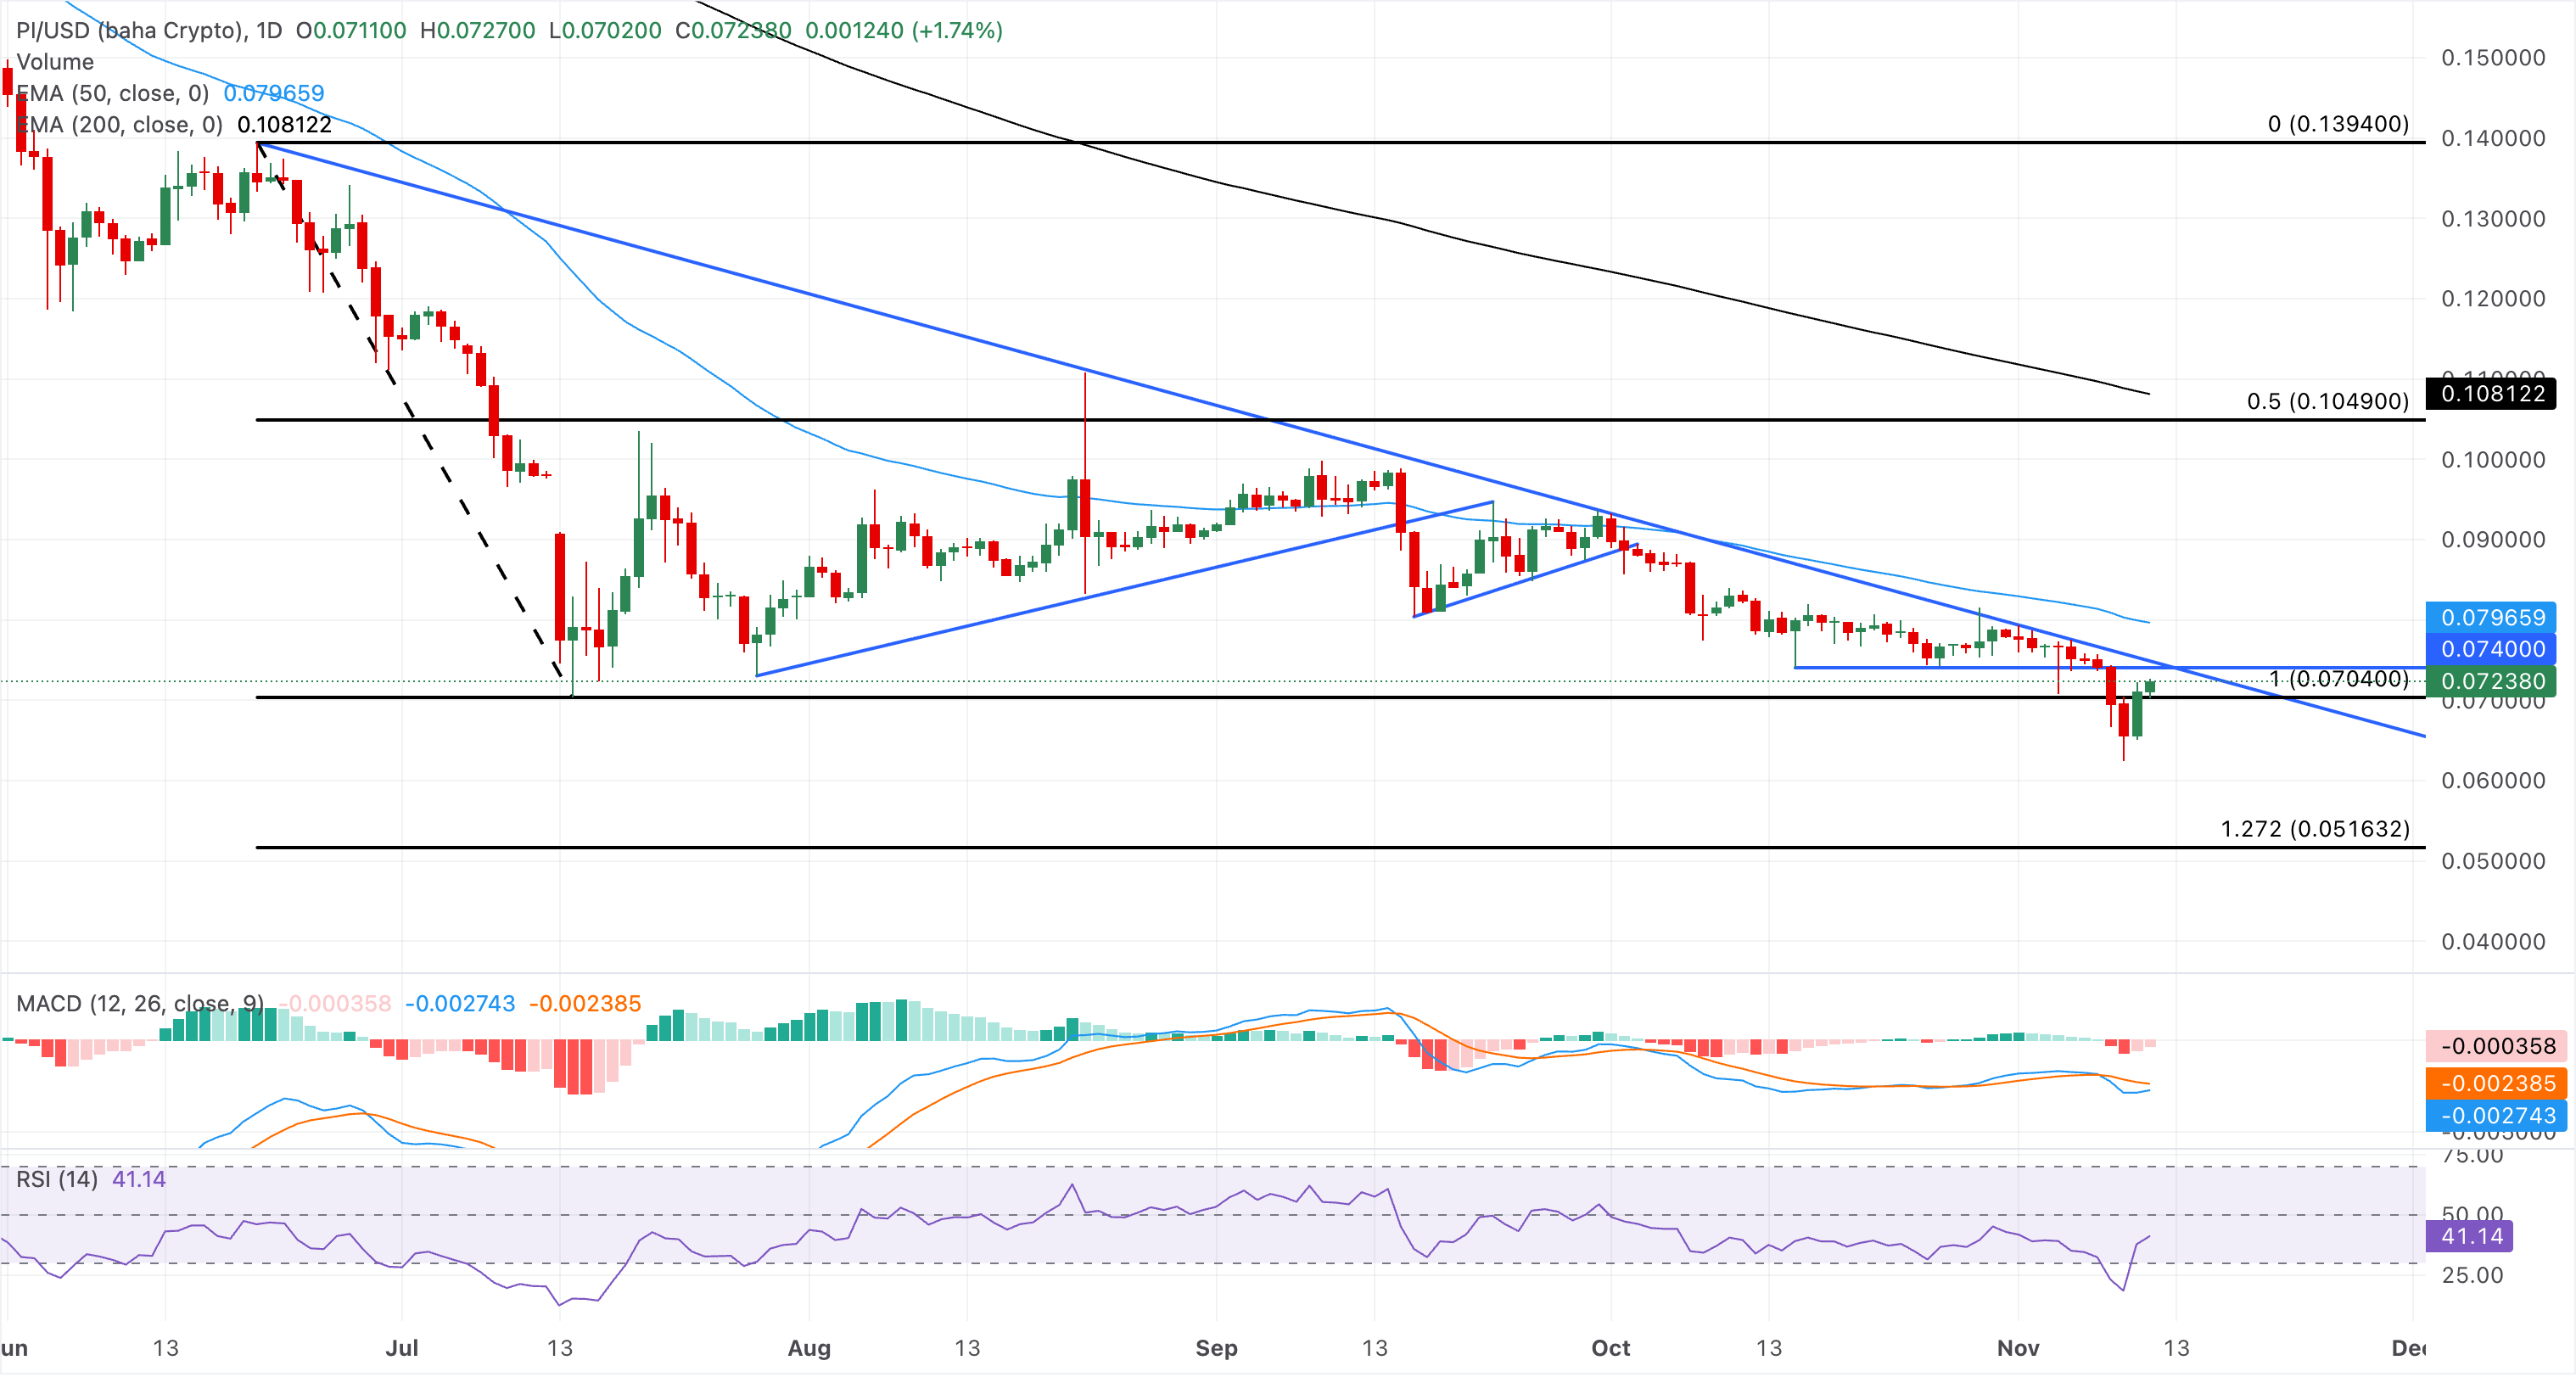
Should prices fall, structural support lies near the reclaimed $0.0704 level, where sellers may pause on an initial test. Below that, the next support is the 127.2% Fibonacci extension at $0.0516, measured from $0.1394 to $0.0704.
(An AI tool assisted in the preparation of this article’s technical analysis. Find out more.)










The information provided on this website is of a general nature only and does not constitute personal financial advice. Before acting on any information on this website, you should consider the suitability of the information in relation to your objectives, financial situation and needs. Investing in CFDs and FX Margin Contracts carries significant risks and is not suitable for all investors. You may lose more than your initial deposit. You do not own, or have, any interest in the underlying asset. We recommend that you seek independent advice and ensure you fully understand the risks involved before trading. It is important that you read and consider the disclosure document before you acquire any product listed on the website. The information and advertisements offered on this website are not intended for use by any person in any country or jurisdiction where such use would be contrary to local laws and regulations. The Products and Services offered on this website are not intended for residents of the United States, Malaysia and Thailand.
TMGM is authorized and regulated in various jurisdictions.
Trademax Australia Limited, trading as TMGM, is regulated by the Australian Securities and Investments Commission (ASIC), AFSL no. 436416 and is located at Level 28, One International Tower, 100 Barangaroo Avenue, 2000 Sydney, NSW Australia.
Email: support@tmgm.com.au
Trademax Global Limited, trading as TMGM, is authorized and regulated by the Vanuatu Financial Services Commission (VFSC), registration number 40356 and registered at 1276, Kumul Highway, Port Vila, Vanuatu, Republic of Vanuatu.
Email: support@tmgm.com
Trademax Global Markets (SE) Limited, trading as TMGM, is authorized and regulated by the Financial Services Authority (FSA) of Seychelles, with license number SD224. The company is registered at Office No 13, Providence Estate ABIS Centre, Mahe, Seychelles.
Email: support@tmgm.com
Trademax Global Markets (International) Pty Ltd, trading as TMGM, is authorized and regulated by the Financial Services Commission, Mauritius (FSC) with license no. GB22201012, and registered at 33, Edith Cavell Street C/o IQ EQ Fund Services (Mauritius) Ltd Port Louis, 11324 Mauritius.
Email: support@tmgm.com
Copyright © TMGM. All rights reserved


