


Introduction to Trend Trading

Trend trading is a strategy designed to capitalize on an asset's momentum in a specific direction. This technique relies on the principle that financial instruments often exhibit identifiable trends, and by detecting these trends early, traders can profit by following the momentum.
Although no single indicator guarantees market success, certain proven strategies remain essential tools for trend traders. Successful trading also demands robust risk management, a solid grasp of trading psychology, and ongoing education.
Moving Averages: Filtering Market Noise
Moving averages (MAs) are core components of technical analysis. They provide a continuously updated average price that smooths out random price fluctuations. By reducing short-term volatility, they assist traders in identifying the prevailing trend direction.
Key Points:
Commonly used are 200-day, 100-day, and 50-day simple moving averages (SMAs)
They help identify trend direction, support and resistance levels, and generate trade signals
Crossovers between different MAs can signal potential trend reversals
Exponential Moving Averages (EMAs) assign greater weight to recent prices, responding more quickly to price changes
Practical Application:
Uptrend: Moving average line sloping upwards
Buy Signal: When a short-term MA crosses above a long-term MA (e.g., 50-day crossing above 200-day, known as the "Golden Cross")
Sell Signal: When a short-term MA crosses below a long-term MA (e.g., 50-day crossing below 200-day, known as the "Death Cross")
Support/Resistance: Price often rebounds off moving average lines, especially the 200-day MA
Advanced Strategies:
Multiple MA Confluence: Confirm trend strength by using several MAs (e.g., 20, 50, and 200-day). A strong trend is indicated when all MAs align in proper order.
MA Ribbon: Plot multiple MAs closely spaced to create a ribbon. The ribbon's expansion and contraction can reveal trend strength and possible reversals.
Example:
Suppose you're analyzing the EUR/USD forex pair. The 50-day MA has just crossed above the 200-day MA, forming a Golden Cross. This may indicate a long position entry, especially if other indicators confirm the bullish momentum.
Moving Average Convergence Divergence (MACD): Momentum and Trend Indicator
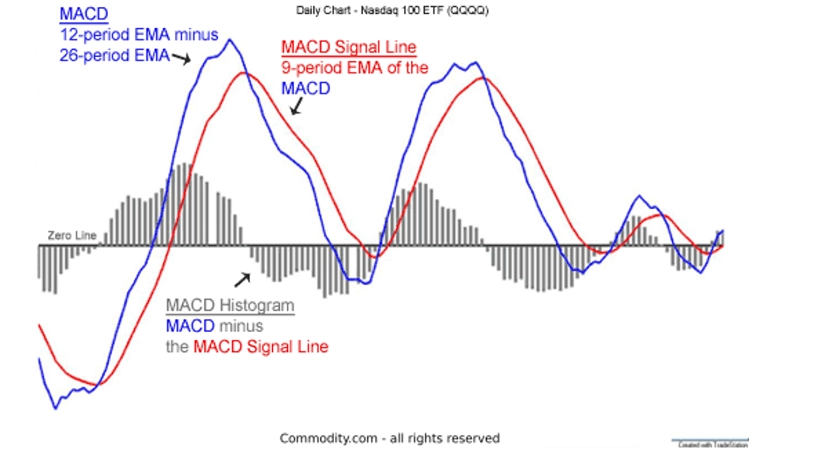
The MACD is a flexible oscillator combining trend-following and momentum aspects. It is calculated by subtracting the 26-period EMA from the 12-period EMA and is displayed alongside a 9-period EMA signal line.
Key Points:
It features two lines: a fast line (MACD line) and a slow line (signal line), plus a histogram
Offers insights into trend direction and momentum
Generates buy/sell signals via line crossovers and zero-line crossings
Divergences between MACD and price can indicate potential trend reversals
Practical Application:
Uptrend: MACD lines above zero
Buy Signal: The fast line crosses above the slow line
Sell Signal: The fast line crosses below the slow line
Increasing Momentum: Histogram bars expanding
Decreasing Momentum: Histogram bars contracting
Advanced Strategies:
MACD Histogram Divergence: Watch for divergences between the MACD histogram and price. If price makes higher highs but the histogram forms lower highs, it may signal a weakening uptrend.
Zero Line Rejections: When the MACD approaches the zero line but fails to cross before reverting to the trend, it can be a strong continuation signal.
Example:
Imagine you're trading gold futures. The price has been trending upwards, and you observe the MACD line crossing above the signal line while both remain above zero. This could be a strong buy signal, suggesting the uptrend will continue with growing momentum.
Relative Strength Index (RSI): Identifying Overbought and Oversold Levels
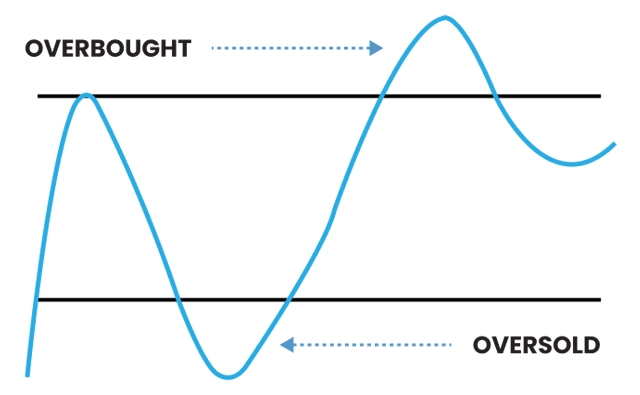
The RSI is an oscillator ranging from 0 to 100, assisting traders in spotting potential reversals and gauging trend strength by measuring the velocity and magnitude of price changes.
Key Points:
Standard overbought threshold at 70, oversold at 30
In strong trends, these thresholds may be adjusted (e.g., 80/20)
Useful for confirming trend direction and detecting divergences
RSI can form chart patterns such as double tops or bottoms
Practical Application:
Uptrend: RSI consistently approaching or exceeding 70
Downtrend: RSI consistently approaching or falling below 30
Buy Signal in Uptrend: RSI dips below 50 then climbs back above it
Sell Signal in Downtrend: RSI rises above 50 then falls back below it
Divergence: Price makes new highs while RSI fails to do so (potential reversal alert)
Advanced Strategies:
RSI Range Shifts: In strong trends, RSI may establish a shifted range, e.g., oscillating between 40 and 80 in a strong uptrend instead of 30 and 70.
Failure Swings: A failure swing above 70 or below 30 can signal a strong reversal. For instance, if RSI moves above 70, pulls back, then fails to reach 70 on the next rally, it may indicate a bearish reversal.
Example:
Imagine trading the S'P 500 index. The price steadily rises, but while price hits new highs, RSI forms lower highs. This bearish divergence warns that the uptrend may be weakening and a reversal could be imminent.
On-Balance Volume (OBV): Volume-Based Trend Confirmation

OBV is a cumulative indicator linking volume to price changes, aiding in confirming trend strength. It operates on the principle that volume often precedes price movements.
Key Points:
Adds volume on up days, subtracts on down days
Should ideally move in tandem with price trends
Divergences can indicate potential reversals
Helps identify accumulation and distribution phases
Practical Application:
Trend Confirmation: OBV rising alongside price in an uptrend
Leading Indicator: OBV increasing while price remains flat may signal an impending breakout
Divergence: OBV declining while price rises can suggest a weakening uptrend
Breakout Confirmation: A price breakout accompanied by a surge in OBV indicates a strong, valid breakout
Advanced Strategies:
OBV Moving Average: Apply a moving average to the OBV line. Crossovers between OBV and its MA can generate trade signals.
Volume-Price Confirmation: Combine OBV with price action. For example, a bullish engulfing candle paired with a sharp OBV increase can be a strong buy signal.
Example:
Suppose you're analyzing a tech stock consolidating within a narrow range. While the price remains flat, OBV steadily rises, indicating accumulation and suggesting a potential upward breakout, offering a buying opportunity before the breakout.
Combining Indicators for More Effective Trend Trading
While each indicator is powerful individually, combining them can deliver stronger trade signals and reduce false positives. Consider these approaches:
Trend Confirmation: Use Moving Averages to define the overall trend, then employ MACD for precise entry timing.
Momentum Validation: Validate MACD signals with RSI readings. For instance, a MACD bullish crossover is more reliable if RSI is rising and below 70.
Volume Verification: Confirm trend strength identified by Moving Averages and MACD using OBV.
Divergence Detection: Look for divergences across multiple indicators. If price, MACD, RSI, and OBV all diverge, it's a strong reversal signal.
Remember, while combining indicators enhances signal quality, it can also cause analysis paralysis. Maintain a clear trading plan and avoid overcomplicating your strategy.
Risk Management in Trend Trading
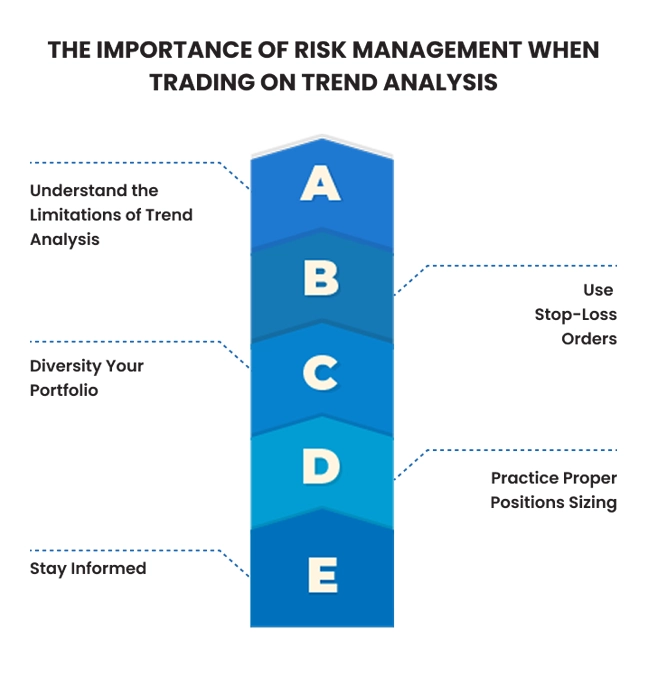
Identifying trends is vital, but managing risk is equally critical for sustainable trading success. Incorporate these risk management principles into your trend trading approach:
Position Sizing: Limit risk to a small percentage (typically 1-2%) of your trading capital per trade.
Stop-Loss Orders: Always set stop-loss orders to cap potential losses if the trend reverses.
Trailing Stops: In strong trends, use trailing stops to secure profits while allowing winners to run.
Correlation Awareness: Be mindful of holding multiple trend trades in highly correlated assets, as this elevates portfolio risk.
Market Context: Consider broader market conditions and upcoming events that might affect your trades.
Empowering Your Trading with TMGM
Mastering these trend trading indicators can greatly improve your ability to identify and exploit market trends. However, remember that no indicator is foolproof, and combining multiple indicators typically produces the best outcomes.
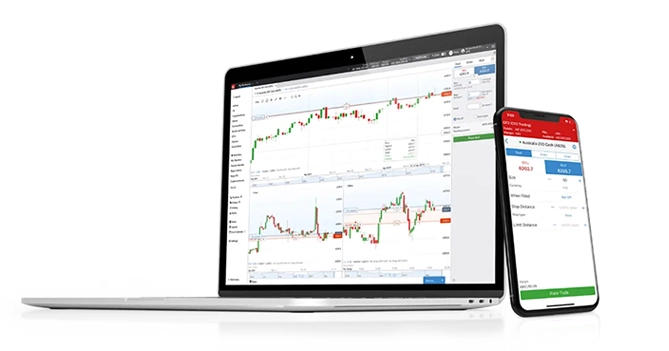
TMGM is dedicated to equipping clients with education, tools, and support to navigate the complexities of forex and CFD trading. Our advanced trading platforms provide access to these indicators and many others, enabling you to implement sophisticated trend trading strategies with ease.
Whether you're an experienced trader or just beginning, TMGM offers a variety of resources to help you enhance your skills and make informed trading decisions. From expert market analysis to personalized support, we're committed to your trading success.
Ready to apply these trend trading strategies?
Open an account with TMGM today and experience the advantages of trading with a world-class broker. Our platforms feature:
Advanced charting tools with customizable indicators
Real-time market data and news feeds
Risk management tools, including guaranteed stop-loss orders
Educational resources such as webinars, tutorials, and one-on-one coaching
Visit our website to discover more about our competitive spreads, advanced platforms, and extensive educational offerings.
Remember, successful trading is an ongoing journey of learning and adaptation. Stay informed, apply sound risk management, and continuously refine your strategy.
With TMGM supporting you, you're well-prepared to navigate the exciting challenges of trend trading in today's dynamic markets.
Begin your trend trading journey with TMGM now and unlock your potential in the financial markets!


