
Bitcoin Weekly Forecast: The return of the sellers
By Manish Chhetri
Updated: 22 May 2026


POPULAR ARTICLES

Bitcoin (BTC) remains under pressure so far this week, consolidating around $77,000 on Friday after being rejected from the overhead supply zone the previous week. The institutional sell-off continues, with spot BTC Exchange-Traded funds (ETFs) recording billions in outflows.
- Bitcoin consolidates around $77,000 on Friday following a rollercoaster week.
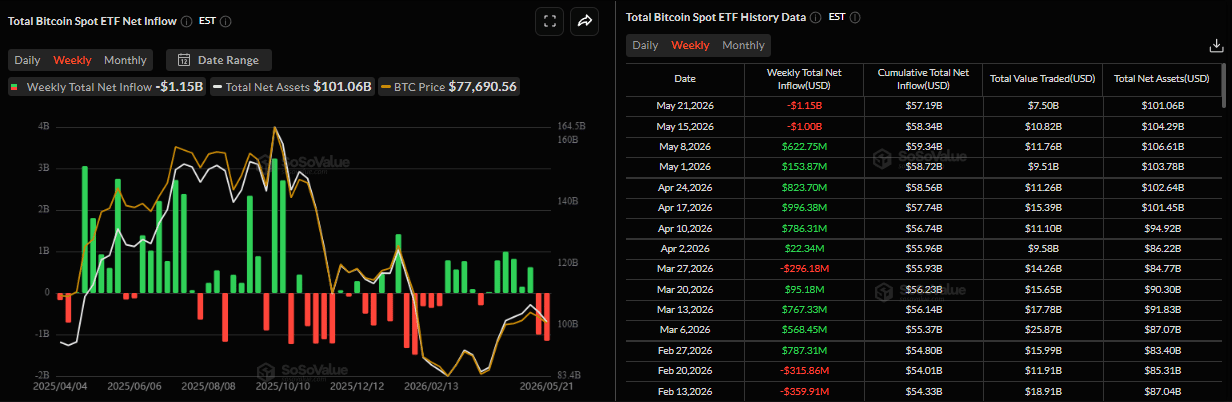
- US-listed spot ETFs recorded outflows of over $1.15 billion through Thursday, pointing to the second consecutive week of withdrawals.
- A hawkish Fed stance, net demand contraction, and uncertainty over US-Iran peace talks keep sentiment bearish.
Bitcoin (BTC) remains under pressure so far this week, consolidating around $77,000 on Friday after being rejected from the overhead supply zone the previous week. The institutional sell-off continues, with spot BTC Exchange-Traded funds (ETFs) recording billions in outflows. The macro environment doesn't help either: the hawkish Federal Reserve (Fed) tone, net demand contraction and growing uncertainty over US-Iran peace talks put a lid on the Crypto King’s price. Are the sellers here to stay?
ETFs outflows accelerate
Institutional demand continued to weaken so far this week. SoSoValue data showed that spot BTC ETFs recorded an outflow of $1.15 billion through Thursday. Unless Friday’s inflows are very significant, BTC would mark the second week of $1 billion in weekly outflows, signaling weakening institutional demand and potentially leading to a price decline.
Uncertainty about the Iran-US peace deal keeps investors cautious
Beyond the rising outflows from ETFs, mixed signals on a potential US-Iran peace deal continue to cap risk appetite among traders.
A senior Iranian source said that no deal has been reached with the US, but also acknowledged that the gaps in positions between the two sides have narrowed. However, Iran’s uranium enrichment and Tehran’s control over the critical Strait of Hormuz remain among the sticking points.
US Secretary of State Marco Rubio warned that Iran’s desire to impose a toll on ships passing through the Strait was acting as a blockade to a potential peace agreement.
US President Donald Trump also said that the US does not want tolls on the Strait of Hormuz and added that the US military will retrieve Iran’s stockpile of highly enriched uranium.
This keeps geopolitical risk premium in play and caps BTC upside move. Any escalation or intervention by the US or Iran during the weekend could further dampen risk appetite, leading to a correction in BTC.
Could Iran boost the BTC narrative?
The Kobeissi Letter reported late Monday that Iran has introduced “Hormuz Safe,” a Bitcoin-backed insurance service for shipping companies seeking to transit the Strait of Hormuz.
According to the report, the Iranian government estimates the initiative could generate more than $10 billion in revenue and stated that the program will primarily serve Iranian shipping companies and cargo owners.
“The shipment will be covered from the moment of confirmation, and a signed receipt will be given to the owner,” Iran said. It is unclear whether this insurance service will be charged in addition to tolls, which have reached as high as $2 million per ship. Iran added that an official website containing further details about the program is expected to launch soon.
These developments follow Iran’s proposal in early April that shipping companies pay tolls in cryptocurrency for oil tankers passing through the Strait of Hormuz.
As explained in a previous report, Iran relies on cryptocurrencies due to US sanctions, and Bitcoin has served as a tool for paying for imports and settling trade. Iran legalized crypto mining in 2019 and has since seen it play a role in its economy.
These latest developments with the Bitcoin-backed insurance service, if implemented, could mark a key milestone in adoption, particularly for regions facing financial constraints or under sanctions. This development could boost Bitcoin demand in the near term, as 20% of global Oil tankers pass through the Strait of Hormuz.
Hawkish Fed could weigh on risk appetite
On the macroeconomic front, the Federal Open Market Committee (FOMC) Minutes for the April meeting, released on Wednesday, confirmed a hawkish tone among Federal Reserve's (Fed) officials.
The majority of Fed members warned the central bank would likely need to consider raising interest rates if inflation continued to run persistently above the 2% target.
This hawkish forward guidance from the Fed will likely lead the central bank to tighten policy, which generally doesn’t bode well for the BTC. In high-interest-rate environments, liquidity declines and markets shift towards safer, yield-bearing assets, weighing on the Crypto King.
Bearish on-chain view
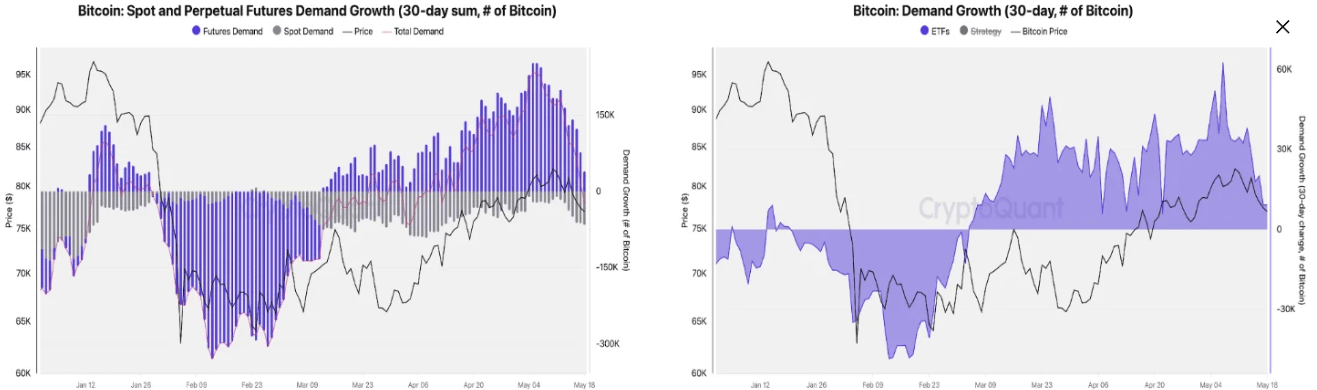
CryptoQuant’s weekly report highlighted that Bitcoin’s overall demand has flipped into net contraction.
As explained previously, BTC’s April rally was mostly driven by perpetual futures demand. Currently, this driving force has reversed sharply after prices hit the key overhead supply zone around $82,000 in the previous week. This indicates that traders closed leveraged long positions, removing the marginal buying pressure that had sustained the upside move.
Looking deeper into the demand side, CryptoQuant's analyst noted: “Spot apparent demand is now contracting at a slightly faster pace than in prior weeks. US-based spot ETFs also turned net sellers, with 30-day ETF demand growth falling to its lowest level in nearly a month.”
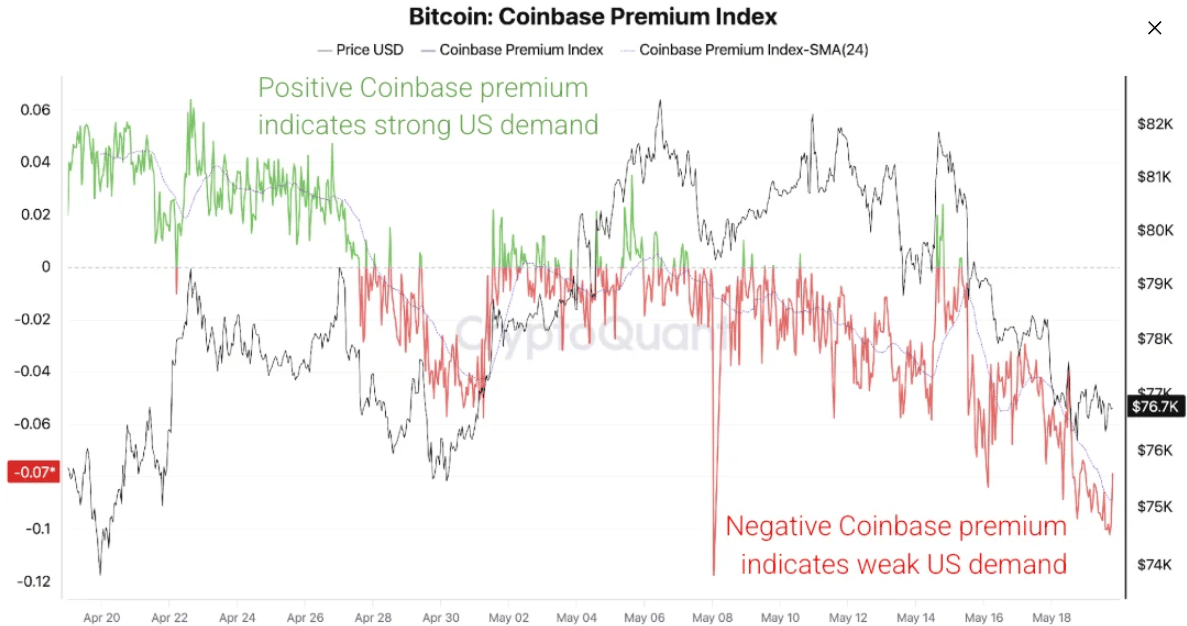
In addition, the Coinbase Bitcoin Price Premium chart below has remained negative so far in the May rally and subsequent correction, confirming that US investor demand has not re-engaged at scale, further indicating weakness in demand.
This combination of futures positioning, spot demand, and ETF flows has historically been more consistent with renewed price weakness than with stable consolidation.
Technical outlook: BTC consolidates after correction
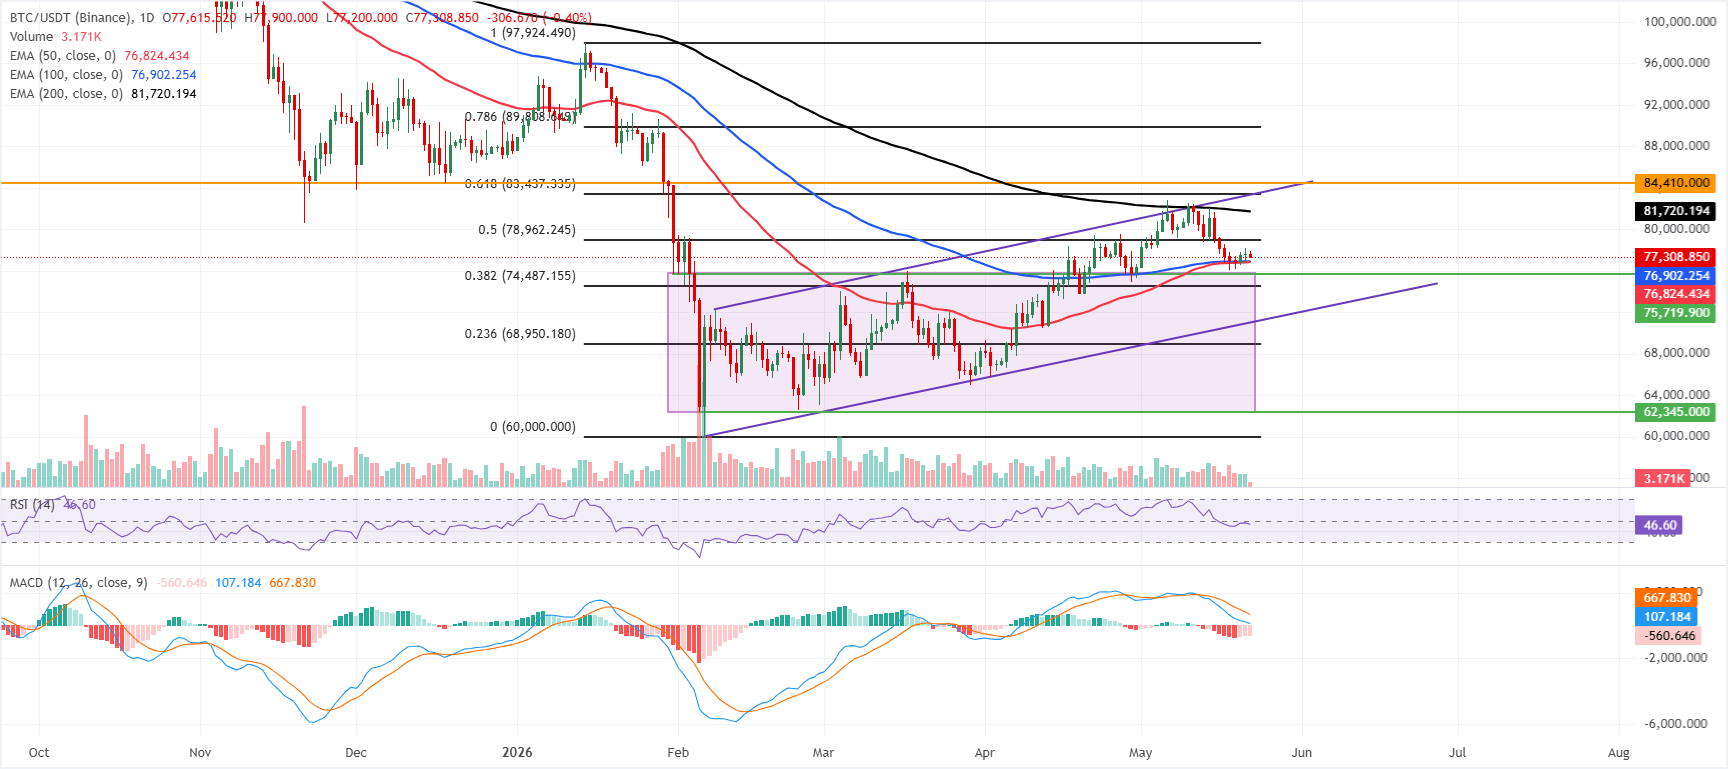
Bitcoin corrected more than 5% in the previous week after being rejected from the overhead supply near the 100-week Exponential Moving Average (EMA) at $82,299. Moreover, BTC closed the week below the 61.8% Fibonacci retracement level at $78,490 (drawn from the October all-time high of $126,199 to the February low of $60,000). As of this week, BTC consolidates below these broken levels, around $77,308 on Friday.
If BTC continues its correction, it could extend the decline toward the key $75,000 psychological support.
Momentum is mixed, with signs of concern: the Relative Strength Index (RSI) slips below the neutral level of 50, reading 46 on Friday, while the Moving Average Convergence Divergence (MACD) histogram remains firmly positive, hinting that bullish pressure is attempting to reassert itself despite the recent correction.
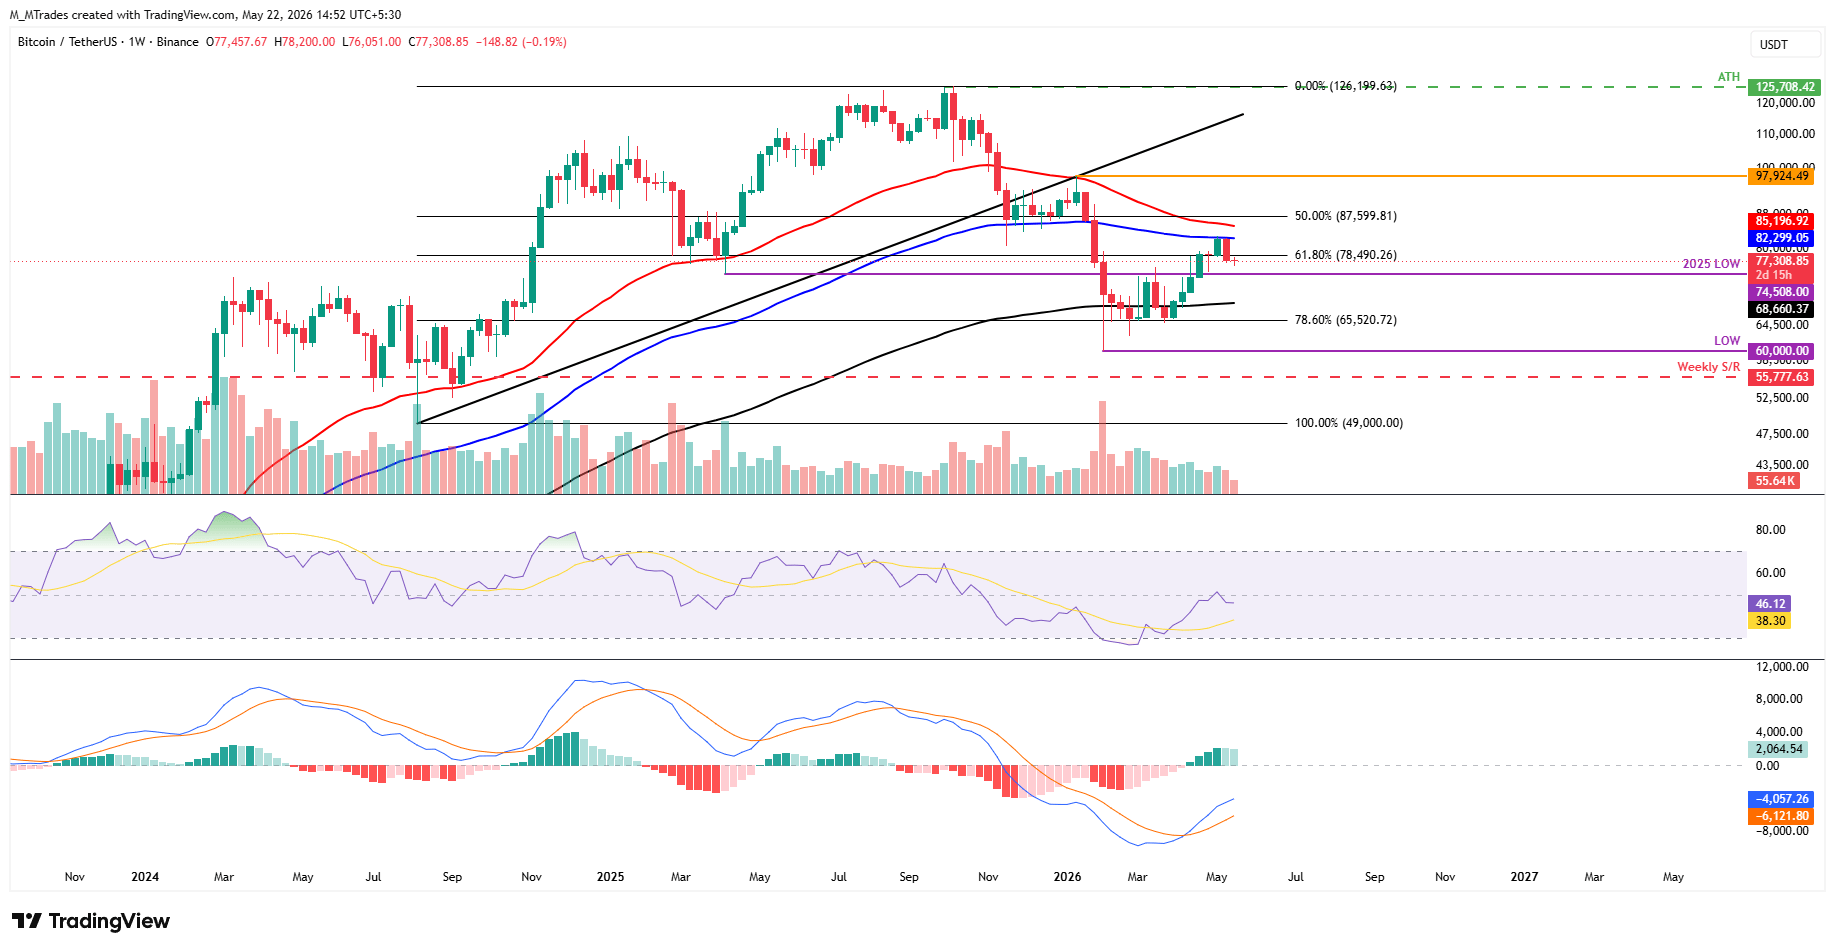
On the daily chart, BTC is holding slightly above the 50-day and 100-day EMAs at $76,824 and $76,902, suggesting ongoing consolidation rather than a clear trend resumption. However, the Crypto King is capped below the 200-day EMA at $81,720.
Momentum leans soft, with the RSI slipping to 46 and the MACD histogram firmly below zero, suggesting upside attempts could continue to face selling pressure unless buyers regain traction above nearby resistance.
On the topside, initial resistance emerges at the 50% Fibonacci retracement (from the January high to the February low) at $78,962, ahead of the 200-day EMA at $81,720. A sustained break over that area would expose the 61.8% Fibonacci retracement at $83,437, with the horizontal barrier at $84,410 acting as a more distant cap.
On the downside, immediate support is provided by the 100-day and 50-day EMAs clustered just beneath spot at $76,902 and $76,824, respectively; a daily close below this band would open the door toward the 38.2% Fibonacci retracement at $74,487, while deeper weakness could see the rising trendline region near $71,029 and the 23.6% Fibonacci retracement level at $68,950 come back into focus.
(The technical analysis of this story was written with the help of an AI tool.)
Bitcoin, altcoins, stablecoins FAQs
Bitcoin is the largest cryptocurrency by market capitalization, a virtual currency designed to serve as money. This form of payment cannot be controlled by any one person, group, or entity, which eliminates the need for third-party participation during financial transactions.
Altcoins are any cryptocurrency apart from Bitcoin, but some also regard Ethereum as a non-altcoin because it is from these two cryptocurrencies that forking happens. If this is true, then Litecoin is the first altcoin, forked from the Bitcoin protocol and, therefore, an “improved” version of it.
Stablecoins are cryptocurrencies designed to have a stable price, with their value backed by a reserve of the asset it represents. To achieve this, the value of any one stablecoin is pegged to a commodity or financial instrument, such as the US Dollar (USD), with its supply regulated by an algorithm or demand. The main goal of stablecoins is to provide an on/off-ramp for investors willing to trade and invest in cryptocurrencies. Stablecoins also allow investors to store value since cryptocurrencies, in general, are subject to volatility.
Bitcoin dominance is the ratio of Bitcoin's market capitalization to the total market capitalization of all cryptocurrencies combined. It provides a clear picture of Bitcoin’s interest among investors. A high BTC dominance typically happens before and during a bull run, in which investors resort to investing in relatively stable and high market capitalization cryptocurrency like Bitcoin. A drop in BTC dominance usually means that investors are moving their capital and/or profits to altcoins in a quest for higher returns, which usually triggers an explosion of altcoin rallies.

More than a million users rely on FXStreet for real-time market data, charting tools, expert insights, and forex news. Its comprehensive economic calendar and educational webinars help traders stay informed and make calculated decisions. FXStreet is supported by a team of about 60 professionals, split between the Barcelona headquarters and various global regions.
Read More


