
Dow Jones Industrial Average tops records on borrowed strength
By Joshua Gibson
Updated: 1 Jul 2026


POPULAR ARTICLES

The Dow Jones Industrial Average (DJIA) hit a fresh record on Wednesday, clipping 52,500 and completing a round trip from April's rout to all-time highs. The headline number flatters the detail underneath it, because the index that set this record is not quite the one that traded a week ago.
- DJIA closed at a record high on Wednesday, extending its rebound off the April low.
- Alphabet's late-June addition to the price-weighted index has increased its tech and AI exposure.
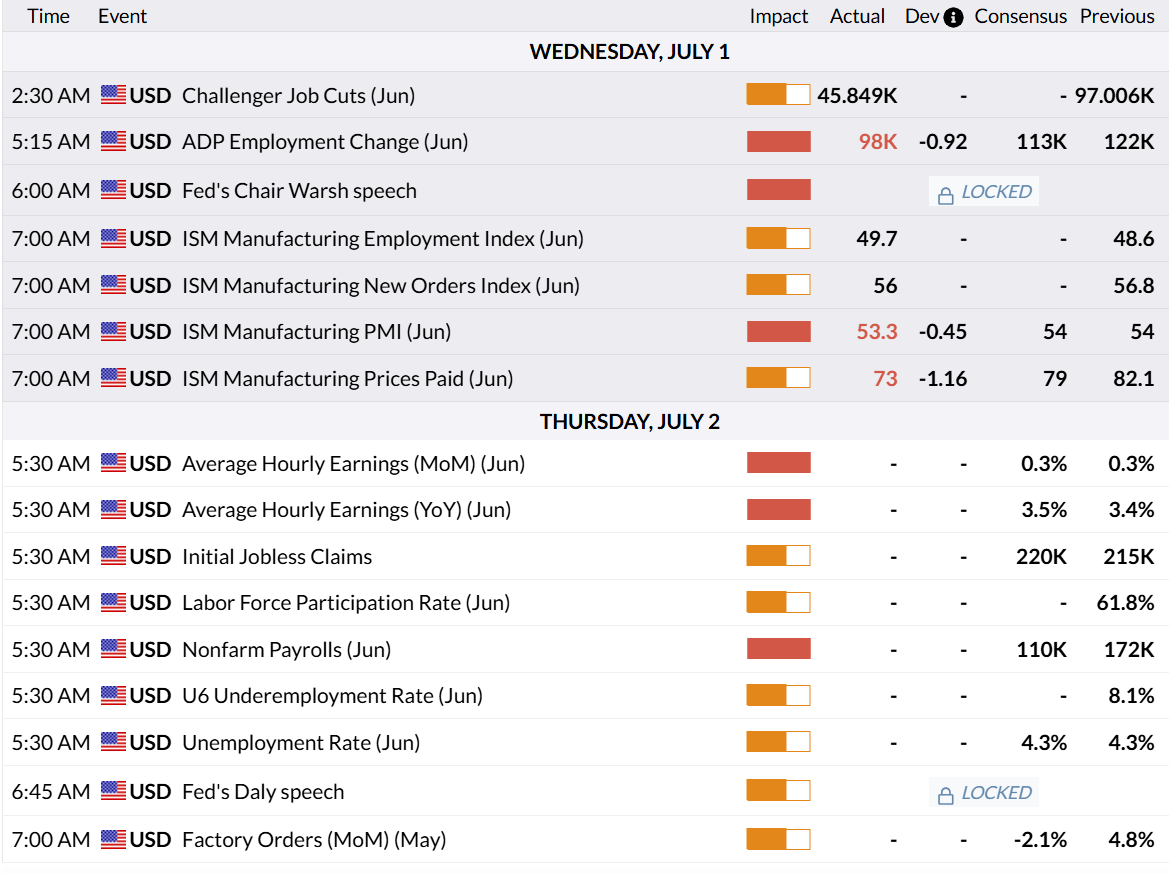
- Nonfarm Payrolls, pulled forward to a shortened Thursday session, is the week's key risk.
The Dow Jones Industrial Average (DJIA) hit a fresh record on Wednesday, clipping 52,500 and completing a round trip from April's rout to all-time highs. The headline number flatters the detail underneath it, because the index that set this record is not quite the one that traded a week ago. A blue-chip average printing highs on a day its semiconductor leaders were being sold deserves a closer look than the round of congratulation it received.
The Dow quietly turned into an AI index
On June 29, Alphabet replaced Verizon among the thirty names in the average, and in a price-weighted index that swap matters more than it sounds. Verizon, trading under $50, barely registered; Alphabet, changing hands near $350, immediately became one of the most influential stocks in the benchmark. A single mega-cap with heavy exposure to artificial intelligence (AI) and cloud now moves the Dow far more than the telecom it displaced. With Alphabet aboard, five of the so-called Magnificent Seven sit inside a benchmark once built on railroads and steel, so the average can grind to records even when the wider chip trade is taking profit. The record owes as much to who is now in the index as to any broad advance across it.
Quarter-end flows do the rest
The calendar has been lending a hand as well. The turn of the quarter forces pension funds and institutional managers to rebalance, selling what has run and buying what has lagged, and this quarter-end has been an unusually lopsided one given how far sectors have diverged. Those flows flatter an index at highs, but they are mechanical rather than fundamental, and they can unwind just as fast once the new month settles in. Wednesday was the first day of that new month.
A labour market freezing, not cracking
Beneath the record, the latest data pointed to a labour market that is stalling rather than accelerating. Private payrolls from Automatic Data Processing (ADP) rose just 98K in June, below the 110K the market wanted and down from 122K a month earlier. Layoffs, though, are not surging; announced job cuts fell sharply on the month, leaving a low-hire, low-fire economy that is neither hot enough to worry the hawks nor weak enough to force a rescue. The rest of the day's numbers told the same lukewarm story. The Institute for Supply Management (ISM) manufacturing Purchasing Managers Index (PMI) slipped to 53.3 from 54, still above the line dividing growth from contraction but hardly booming, while the Federal Reserve (Fed), having held policy at its June meeting, keeps repeating that prices remain too high. That is not the language of a central bank about to ride to the rescue.
Nonfarm Payrolls on a shortened tape
The week's real test lands Thursday at 12:30 GMT, when Nonfarm Payrolls (NFP) arrives a day early: US markets close Friday for the Independence Day holiday and shut early on Thursday afternoon. Consensus looks for around 110K new jobs, a clear step down from 172K, with average hourly earnings seen near 3.5% YoY and unemployment steady at 4.3%. What makes the setup awkward is that a soft print will not automatically buy rate cuts from a Fed still fixated on inflation; a big downside surprise would more likely read as a growth scare than a dovish gift, and thin pre-holiday liquidity would only amplify it.
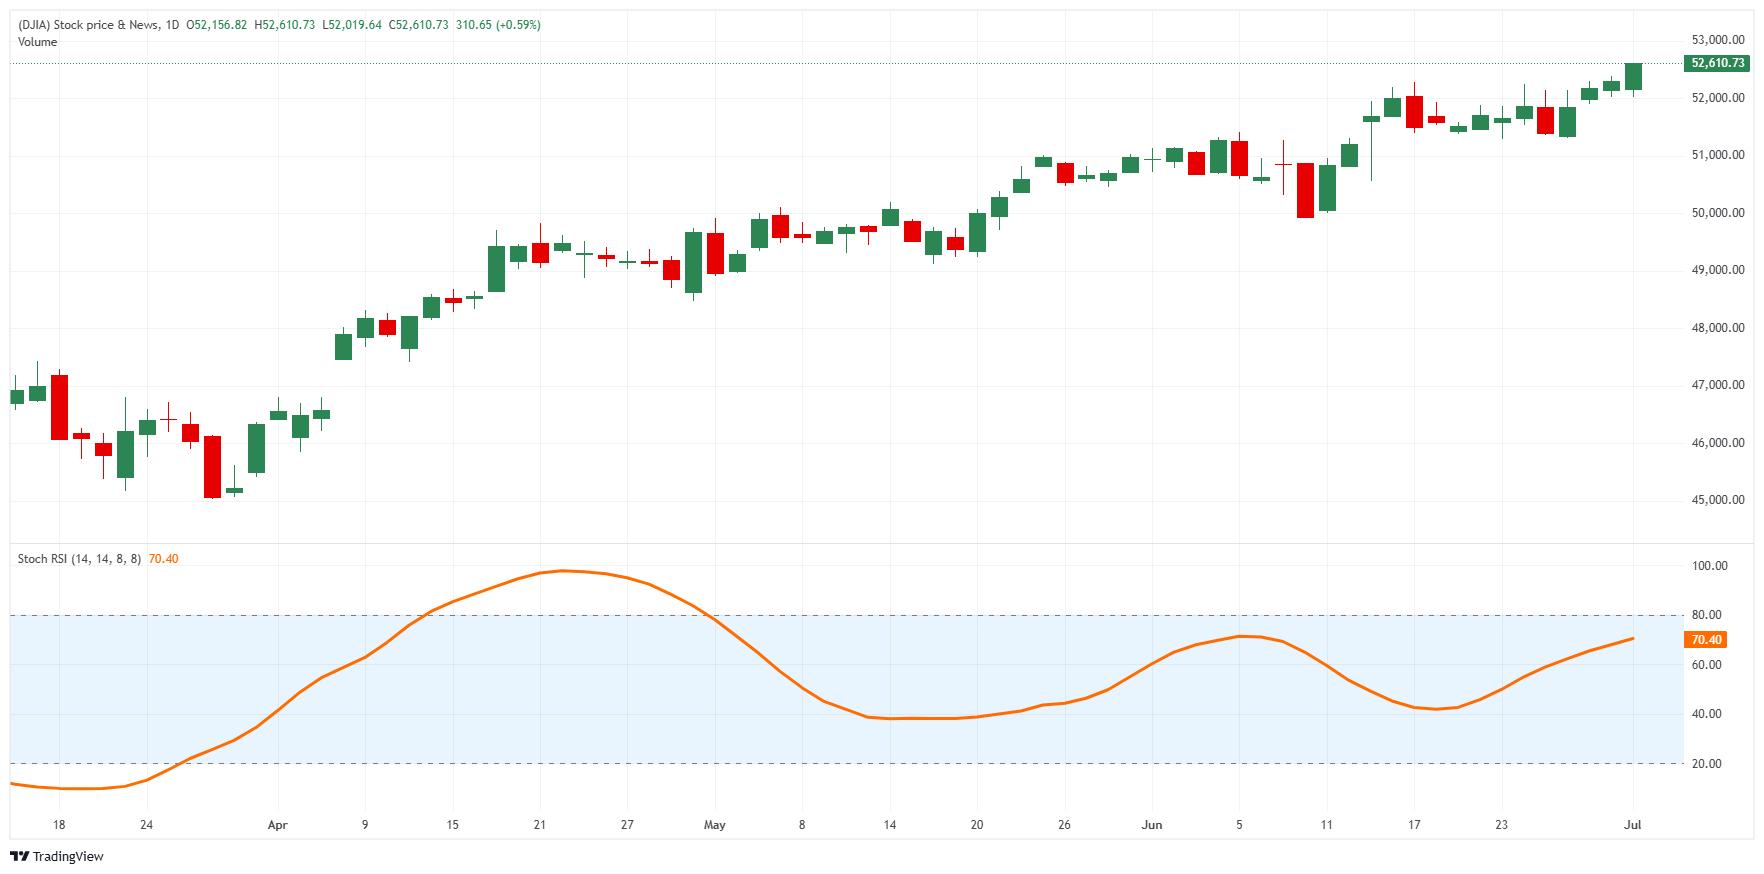
Levels to watch
Resistance: With price in record territory just above 52,500, there is no overhead supply to lean on; the next magnet is the round 53,000 handle, while Wednesday's session high near 52,550 caps the immediate move.
Support: First support sits at the 52,000 handle, then the late-June shelf around 51,500. Below that, the early-June swing low near 50,000 marks the last real pullback zone and a major psychological line.
Bias: Higher while 52,000 holds, but this is not a level to chase. The advance of more than 16% off the April low leaves the index stretched, and with part of the record resting on a composition change and quarter-end flows that can reverse, the organic case is thinner than the chart suggests. A downside NFP surprise on a half-day tape is the likeliest trigger for a shakeout toward 51,500, and buying strength here is a bet on momentum alone, with neither the Fed nor the data offering a floor.
Dow Jones daily chart
Dow Jones FAQs
The Dow Jones Industrial Average, one of the oldest stock market indices in the world, is compiled of the 30 most traded stocks in the US. The index is price-weighted rather than weighted by capitalization. It is calculated by summing the prices of the constituent stocks and dividing them by a factor, currently 0.152. The index was founded by Charles Dow, who also founded the Wall Street Journal. In later years it has been criticized for not being broadly representative enough because it only tracks 30 conglomerates, unlike broader indices such as the S&P 500.
Many different factors drive the Dow Jones Industrial Average (DJIA). The aggregate performance of the component companies revealed in quarterly company earnings reports is the main one. US and global macroeconomic data also contributes as it impacts on investor sentiment. The level of interest rates, set by the Federal Reserve (Fed), also influences the DJIA as it affects the cost of credit, on which many corporations are heavily reliant. Therefore, inflation can be a major driver as well as other metrics which impact the Fed decisions.
Dow Theory is a method for identifying the primary trend of the stock market developed by Charles Dow. A key step is to compare the direction of the Dow Jones Industrial Average (DJIA) and the Dow Jones Transportation Average (DJTA) and only follow trends where both are moving in the same direction. Volume is a confirmatory criteria. The theory uses elements of peak and trough analysis. Dow’s theory posits three trend phases: accumulation, when smart money starts buying or selling; public participation, when the wider public joins in; and distribution, when the smart money exits.
There are a number of ways to trade the DJIA. One is to use ETFs which allow investors to trade the DJIA as a single security, rather than having to buy shares in all 30 constituent companies. A leading example is the SPDR Dow Jones Industrial Average ETF (DIA). DJIA futures contracts enable traders to speculate on the future value of the index and Options provide the right, but not the obligation, to buy or sell the index at a predetermined price in the future. Mutual funds enable investors to buy a share of a diversified portfolio of DJIA stocks thus providing exposure to the overall index.

More than a million users rely on FXStreet for real-time market data, charting tools, expert insights, and forex news. Its comprehensive economic calendar and educational webinars help traders stay informed and make calculated decisions. FXStreet is supported by a team of about 60 professionals, split between the Barcelona headquarters and various global regions.
Read More


