
Hyperliquid gains nearly 200% in 2026: Here’s why the rally could be overextended
By John Isige
Updated: 19 Jun 2026


POPULAR ARTICLES

Hyperliquid (HYPE) is rising toward $70 at the time of writing on Friday, having rebounded from daily support at $66. This recovery follows a sharp pullback from the recent all-time high near $80 established earlier in the week.
- Hyperliquid rebounds toward $70 after finding support near $66 on Friday.
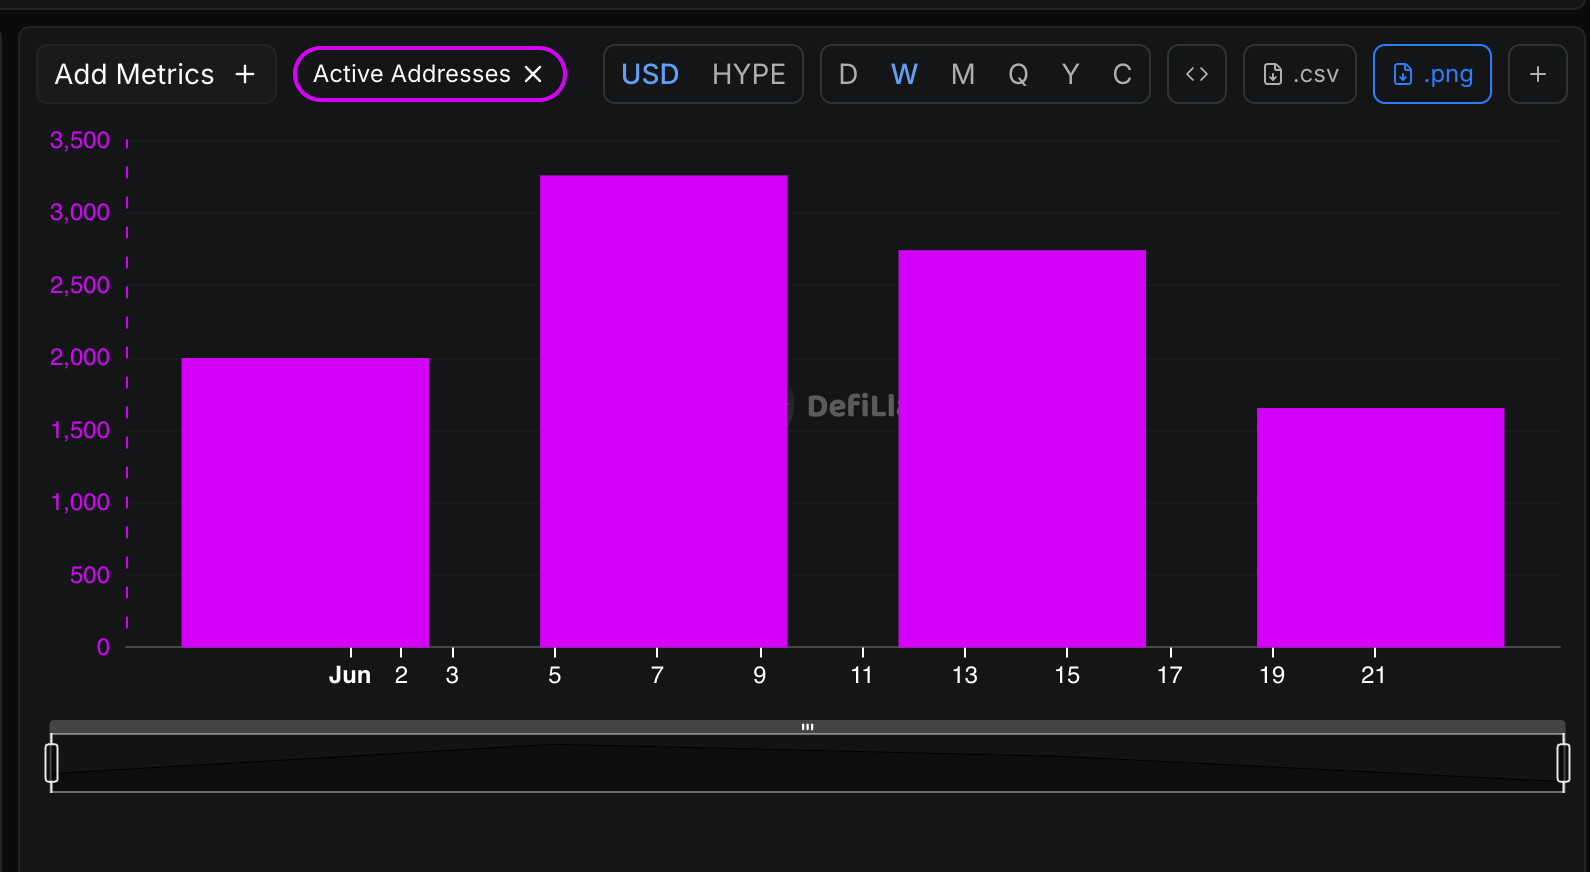
- HYPE’s active on-chain addresses drop week-over-week to 1,650 through Friday, down from roughly 3,300 in early June.
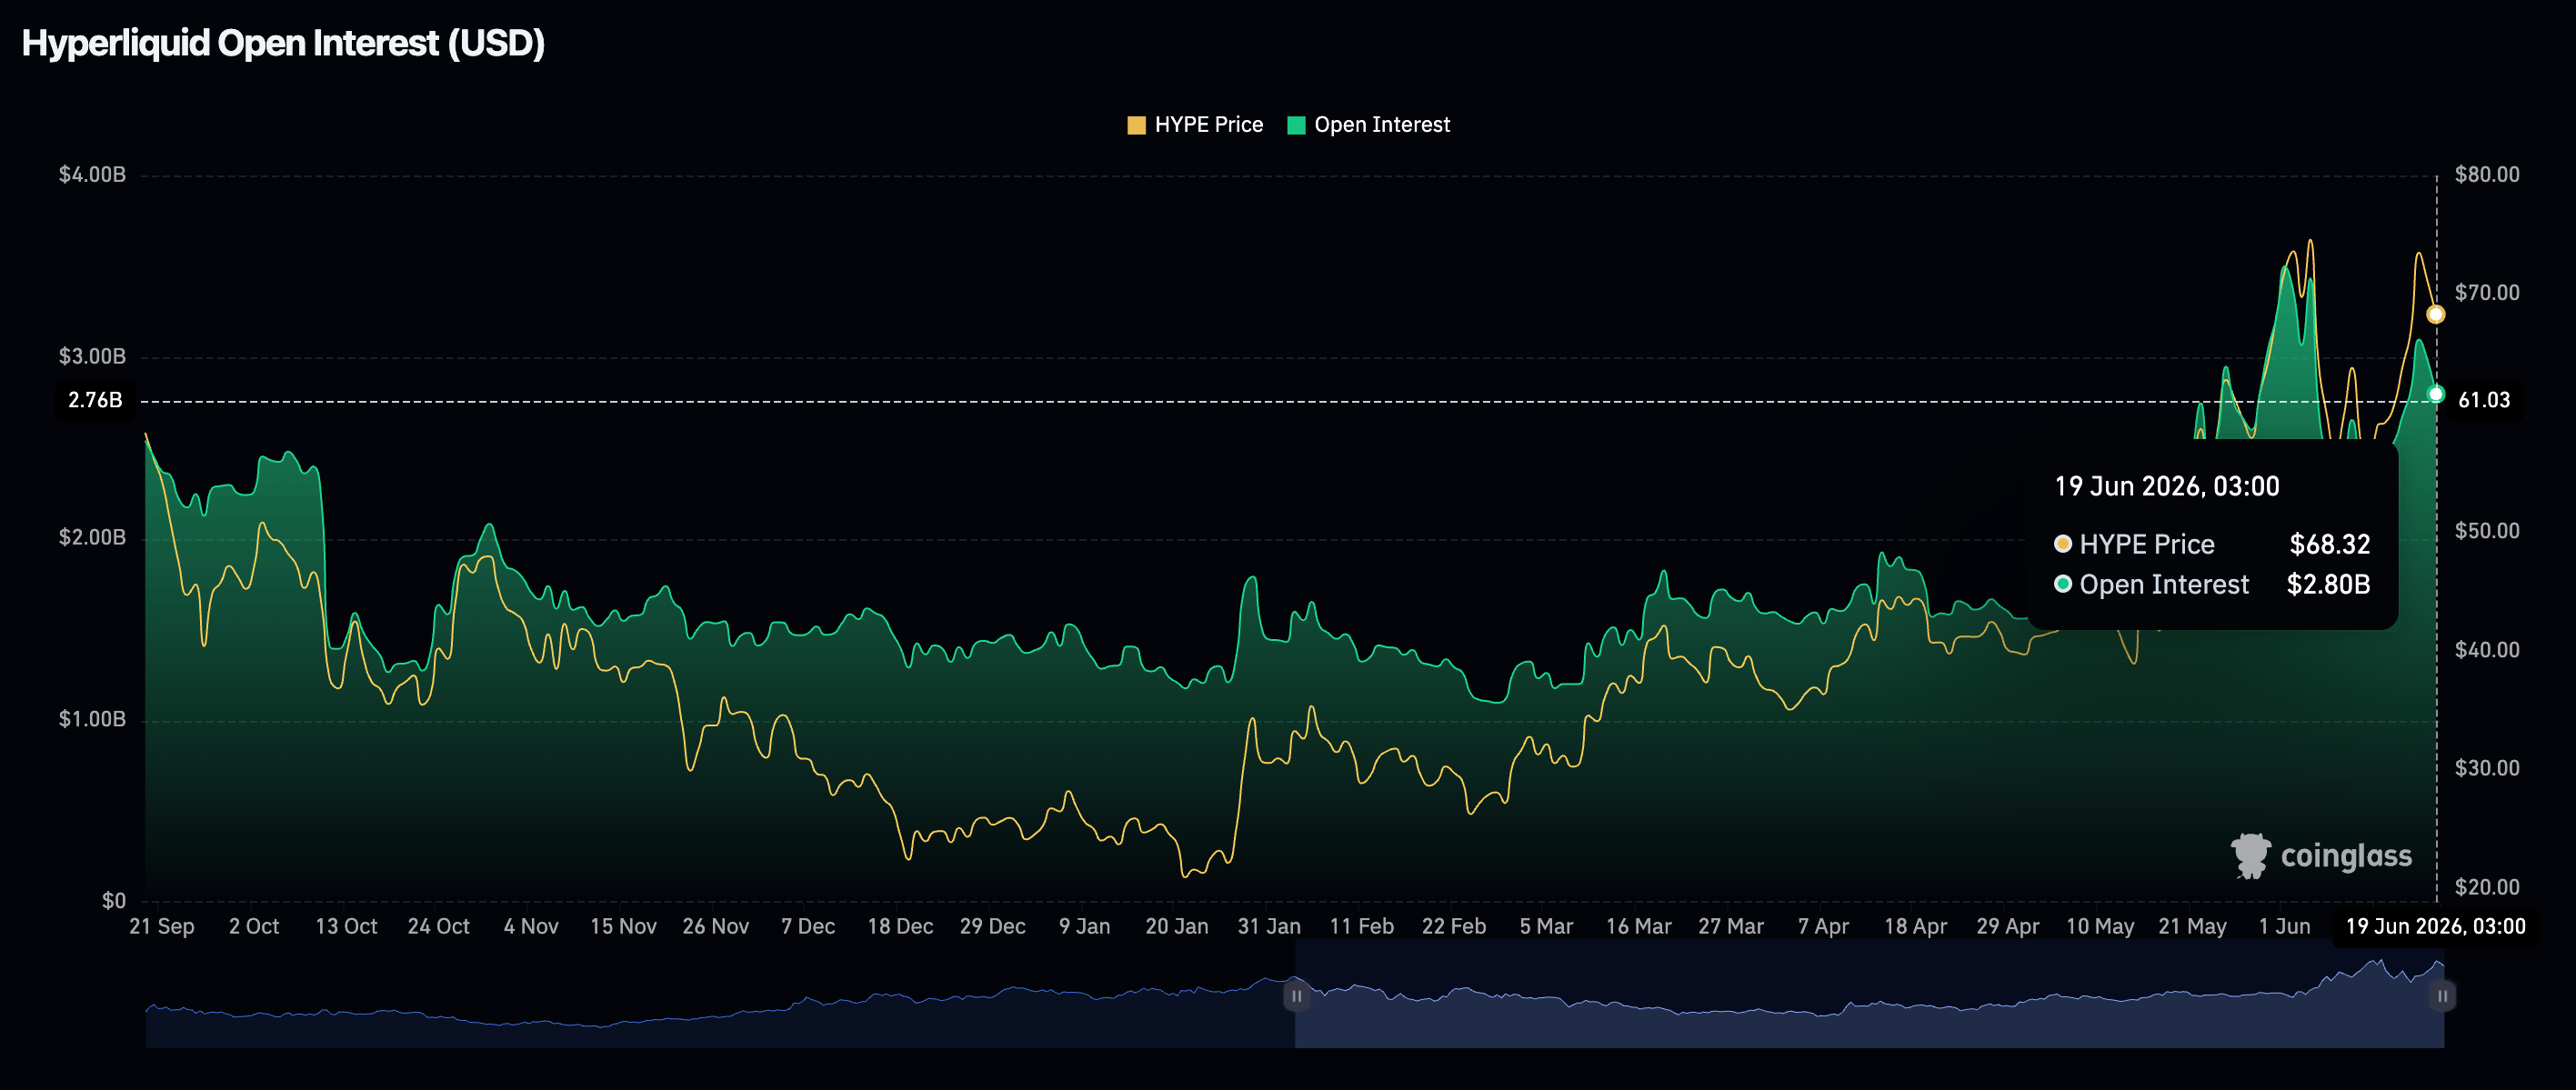
- Hyperliquid derivatives demand cools as futures Open Interest fades to $3 billion, down from $3.50 billion on June 1.
- HYPE’s short-term outlook remains largely bullish, with uptrending major moving averages and a MACD buy signal.
Hyperliquid (HYPE) is rising toward $70 at the time of writing on Friday, having rebounded from daily support at $66. This recovery follows a sharp pullback from the recent all-time high near $80 established earlier in the week.
Since the start of the year, Hyperliquid has surged nearly 200%, reflecting heightened risk appetite among both retail and institutional participants. That said, the current rally looks overextended, and waning market interest could trigger a sharp round of profit-taking and accelerated downside pressure.
Low interest threatens HYPE’s rally
Users actively transacting on the Hyperliquid protocol reached a peak of 3,300 in the first week of June, fuelling interest in the token and contributing to the tailwind that fanned the rally toward the record high.
However, the last few weeks have seen fewer users transact on the blockchain, with roughly 1,650 this week through Friday, undermining the same demand that catalyzed the rally. Subdued on-chain activity for extended periods would weigh on Hyperliquid’s short to medium-term outlook.
The derivative demand shows signs of extended cooling, with futures Open Interest (OI) averaging $2.8 billion on Friday, down from $3 billion the day before and $3.5 billion in early June. This decline in retail demand signals waning investor conviction in HYPE’s ability to sustain its upward momentum, as market participants become increasingly hesitant to initiate new long positions.
Price analysis: Hyperliquid struggles to break short-term resistance
Hyperliquid is showing signs of renewed momentum, consolidating above the key $66 support level. The decentralized exchange (DEX) token maintains a bullish near-term bias as its spot price holds well above the 50-day Exponential Moving Average (EMA) near $58 and the 100-day EMA at $50, keeping the broader uptrend structure intact.
Momentum remains broadly bullish, with a positive Moving Average Convergence Divergence (MACD) histogram on the daily chart. A daily close below the pivotal $70 supply range could weigh on the fragile technical outlook, given that the Stochastic Relative Strength Index (RSI) at 71 suggests that buying pressure is fading rather than increasing.
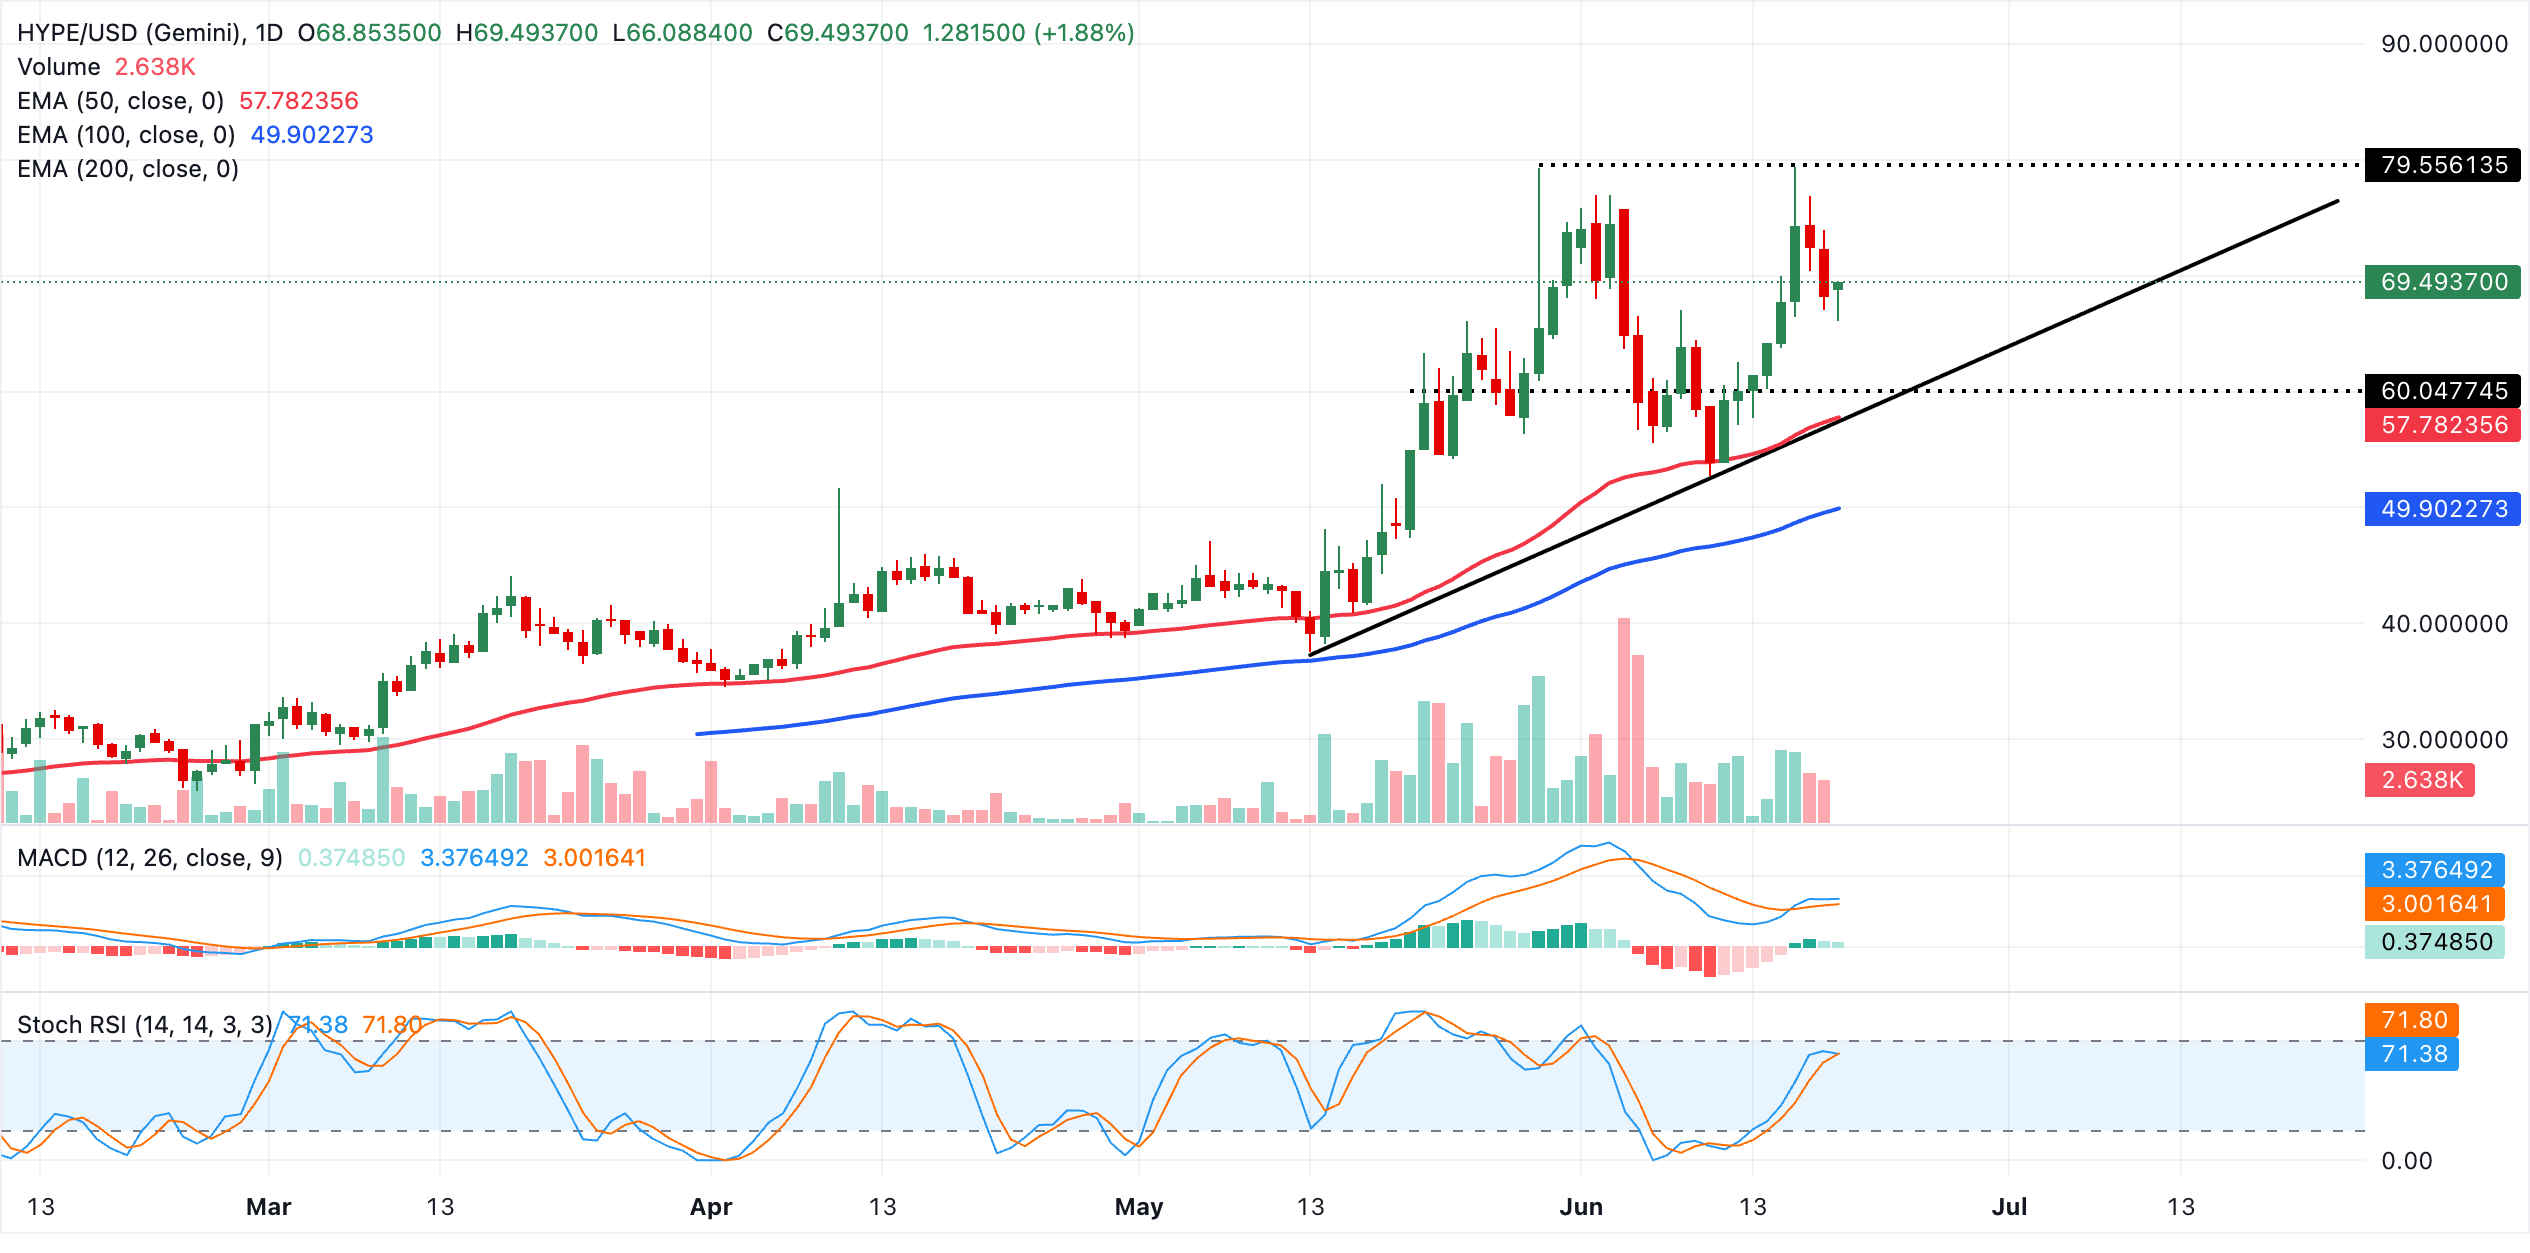
On the downside, initial support lies around the $58 area, where the 50-day EMA converges with the rising trendline, making this the first key zone that buyers would be expected to defend on a pullback. A deeper decline would expose the 100-day EMA near $50 as the next important demand area, where the broader bullish structure would still remain valid as long as HYPE holds above it.
(The technical analysis of this story was written with the help of an AI tool.)
Open Interest, funding rate FAQs
Higher Open Interest is associated with higher liquidity and new capital inflow to the market. This is considered the equivalent of increase in efficiency and the ongoing trend continues. When Open Interest decreases, it is considered a sign of liquidation in the market, investors are leaving and the overall demand for an asset is on a decline, fueling a bearish sentiment among investors.
Funding fees bridge the difference between spot prices and prices of futures contracts of an asset by increasing liquidation risks faced by traders. A consistently high and positive funding rate implies there is a bullish sentiment among market participants and there is an expectation of a price hike. A consistently negative funding rate for an asset implies a bearish sentiment, indicating that traders expect the cryptocurrency’s price to fall and a bearish trend reversal is likely to occur.

More than a million users rely on FXStreet for real-time market data, charting tools, expert insights, and forex news. Its comprehensive economic calendar and educational webinars help traders stay informed and make calculated decisions. FXStreet is supported by a team of about 60 professionals, split between the Barcelona headquarters and various global regions.
Read More


