

British Pound wilts as Oil shock sends US yields past 5%
- GBP/USD slips as Oil-supply fears revive Dollar haven demand.
- Ten-year yield tops 5%, reinforcing Fed hike conviction.
- Softer UK jobs data supports BoE hold expectations.
The Pound Sterling edges lower, by some 0.07%, against the Greenback on Tuesday, with the latter enjoying inflows due to its haven status amid fears of a possible Oil supply shortage. The GBP/USD trades at 1.3487, after peaking at around 1.3505.
Sterling slips as haven Dollar demand builds before Fed, BoE
The escalation of the Middle East conflict and a quick resolution seem far from happening. Both crude Oil benchmarks, Brent and West Texas Intermediate, rose by over 2.40% and 1.10%, respectively, triggering a jump in US Treasury yields, with the 10-year rising to 5.041%, a level last seen in 2007.

Investors reacted, sending bond yields higher, ignited by fears for a second round of inflation. Meanwhile, on September 16, the Federal Reserve is expected to increase rates by 25 basis points, with odds hovering at 95%, according to Prime Terminal.
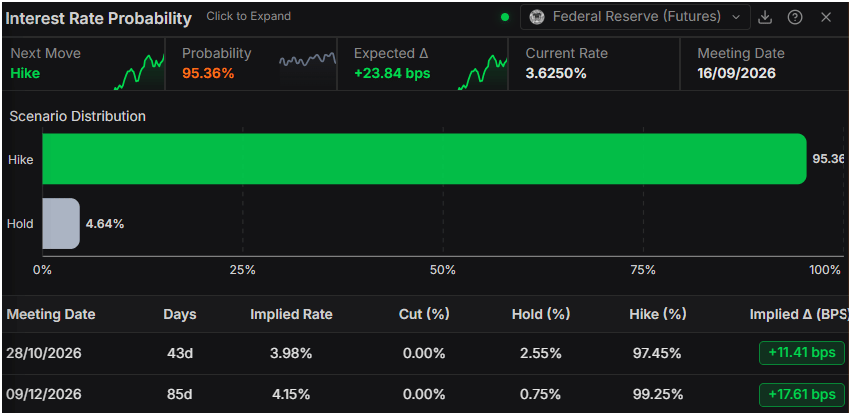
Consequently, the Greenback rose. The US Dollar Index (DXY), which measures the basket of six currencies versus the buck, is up 0.16% at 99.62.
US data revealed the strength of the labour market, with the ADP Employment Change 4-week average rising 16.25K above last week’s print, revised upward to 12.25K.
In the UK, jobs data was weaker, with wages outpacing vacancies, pushing vacancies to a near six-year low. Meanwhile, wages excluding bonuses rose by 3.5% in the three-month rollover to July. Given the backdrop, the Bank of England is expected to hold rates unchanged at the September 17 meeting. However, money markets are pricing in one hike towards the end of 2026, followed by another the following year.
GBP/USD Price Forecast: Technical Outlook
In the daily chart, GBP/USD trades at 1.3478. Near-term bias is neutral to slightly bearish as spot slips just under the clustered simple moving average composite around 1.3483, while still leaning on an uptrend support line near 1.3476. The Relative Strength Index (14) has eased toward the low-40s, suggesting fading bullish momentum, and the break levels of the prior downtrend and current uptrend now frame price action in a tight range.
On the topside, initial resistance is the simple moving average cluster around 1.3483, with a more distant hurdle at the former uptrend break near 1.3691. On the downside, immediate support is aligned with the uptrend break zone at 1.3476, followed by prior downtrend break levels around 1.3460 and 1.3351, where buyers would be expected to re-emerge if the pair extends its pullback.
(The technical analysis of this story was written with the help of an AI tool. Know more.)
Pound Sterling Price Today
The table below shows the percentage change of British Pound (GBP) against listed major currencies today. British Pound was the strongest against the Japanese Yen.
| USD | EUR | GBP | JPY | CAD | AUD | NZD | CHF | |
|---|---|---|---|---|---|---|---|---|
| USD | 0.07% | 0.17% | 0.50% | 0.13% | 0.19% | 0.40% | 0.20% | |
| EUR | -0.07% | 0.10% | 0.41% | 0.06% | 0.11% | 0.33% | 0.13% | |
| GBP | -0.17% | -0.10% | 0.31% | -0.06% | 0.01% | 0.21% | 0.03% | |
| JPY | -0.50% | -0.41% | -0.31% | -0.37% | -0.31% | -0.11% | -0.30% | |
| CAD | -0.13% | -0.06% | 0.06% | 0.37% | 0.06% | 0.27% | 0.07% | |
| AUD | -0.19% | -0.11% | -0.01% | 0.31% | -0.06% | 0.21% | -0.00% | |
| NZD | -0.40% | -0.33% | -0.21% | 0.11% | -0.27% | -0.21% | -0.18% | |
| CHF | -0.20% | -0.13% | -0.03% | 0.30% | -0.07% | 0.00% | 0.18% |
The heat map shows percentage changes of major currencies against each other. The base currency is picked from the left column, while the quote currency is picked from the top row. For example, if you pick the British Pound from the left column and move along the horizontal line to the US Dollar, the percentage change displayed in the box will represent GBP (base)/USD (quote).














