

Trading
Explora una amplia gama de mercados con precios competitivos, liquidez profunda y herramientas de trading avanzadas.
Más información 
Plataforma
Opera sin interrupciones con la potente plataforma de TMGM, diseñada para ofrecer velocidad, precisión y una experiencia de trading superior.
Más información Plataforma de trading
Herramientas de trading
Academia
Aprende los fundamentos del trading con recursos ideales para principiantes, incluidas guías, seminarios web y análisis del mercado.
Más información Academia TMGM
Noticias y análisis
Obtén actualizaciones del mercado en tiempo real y análisis de expertos para adelantarte a las oportunidades de trading
Más información Noticias y análisis
Acerca de
Descubre qué distingue a TMGM: nuestra presencia global, solidez regulatoria y compromiso con la innovación en el trading.
Más información Por qué elegir TMGM
Crypto Today: Bitcoin, Ethereum and XRP gains reinforce bullish outlook
- Bitcoin extends its recovery above $86,000, as bulls target a short-term breakout toward $90,000.
- Ethereum reclaims its position above $2,700 amid a strong technical structure with the RSI uptrending.
- XRP builds momentum, edging higher above $1.50 on Friday as the RSI reaffirms a strong tailwind.
Cryptocurrency prices are broadly recovering on Friday, led by Bitcoin (BTC) moving above $86,000. Ethereum (ETH) has reaffirmed its bullish outlook, rising above $2,700 while the immediate area at $2,800 caps upside. Meanwhile, Ripple (XRP) hovers near $1.54, as bulls tighten their grip for a breakout toward September highs of $1.66.

“Institutional demand remains the foundation of the move. Spot Bitcoin ETF flows are still positive, although less aggressive than earlier in the quarter, while options markets reflect some caution heading into Friday's payrolls report,” Crypto Finance said in an emailed report, adding, “demand for downside protection has picked up, but positioning remains far from defensive.”
Risk appetite remains elevated
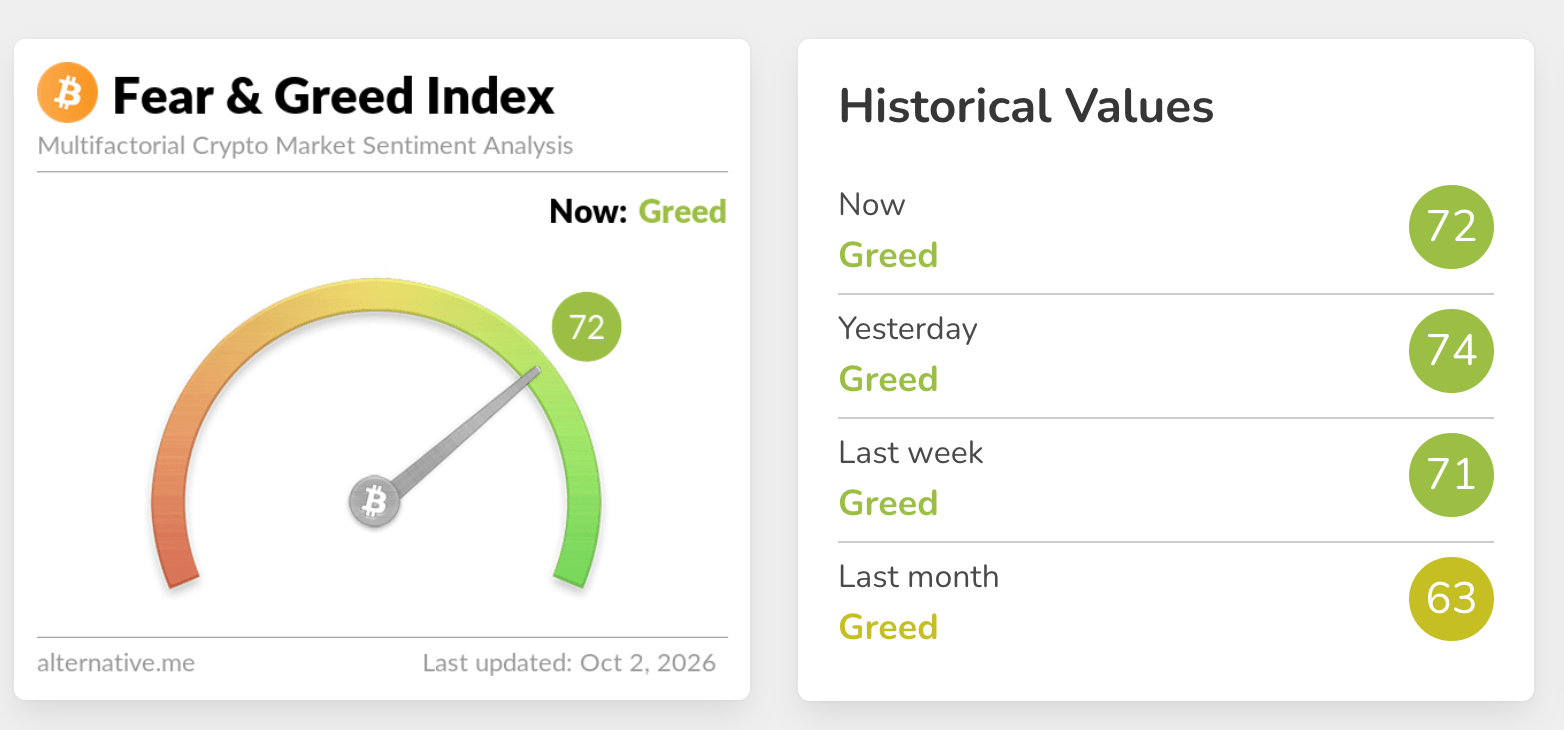
Interest in digital assets remains elevated, as reflected in the crypto Fear & Greed Index, holding at 72 in the Greed territory on Monday, down only marginally from 74 the day before. This steady appetite indicates that the tide in the crypto market has shifted, raising the odds of extended gains.
Technical analysis: XRP bulls reclaim trend control
Bitcoin extends its recovery above $86,000 while holding comfortably above the short and medium-term Exponential Moving Averages (EMAs), with the 50-day EMA at $78,402 and the 100-day EMA at $74,757, while the 200-day EMA at $74,846 reinforces a firmly bullish underlying structure.
The SuperTrend indicator, last at $78,979, also runs below spot and suggests trend-following buyers remain in control. Momentum is constructive, as the Relative Strength Index (RSI) at 68 stays in positive territory without yet registering extreme overbought conditions, even though the Moving Average Convergence Divergence (MACD) lines have slipped back toward the zero line with a slightly negative reading, hinting at a mild loss of upside traction rather than a full reversal.
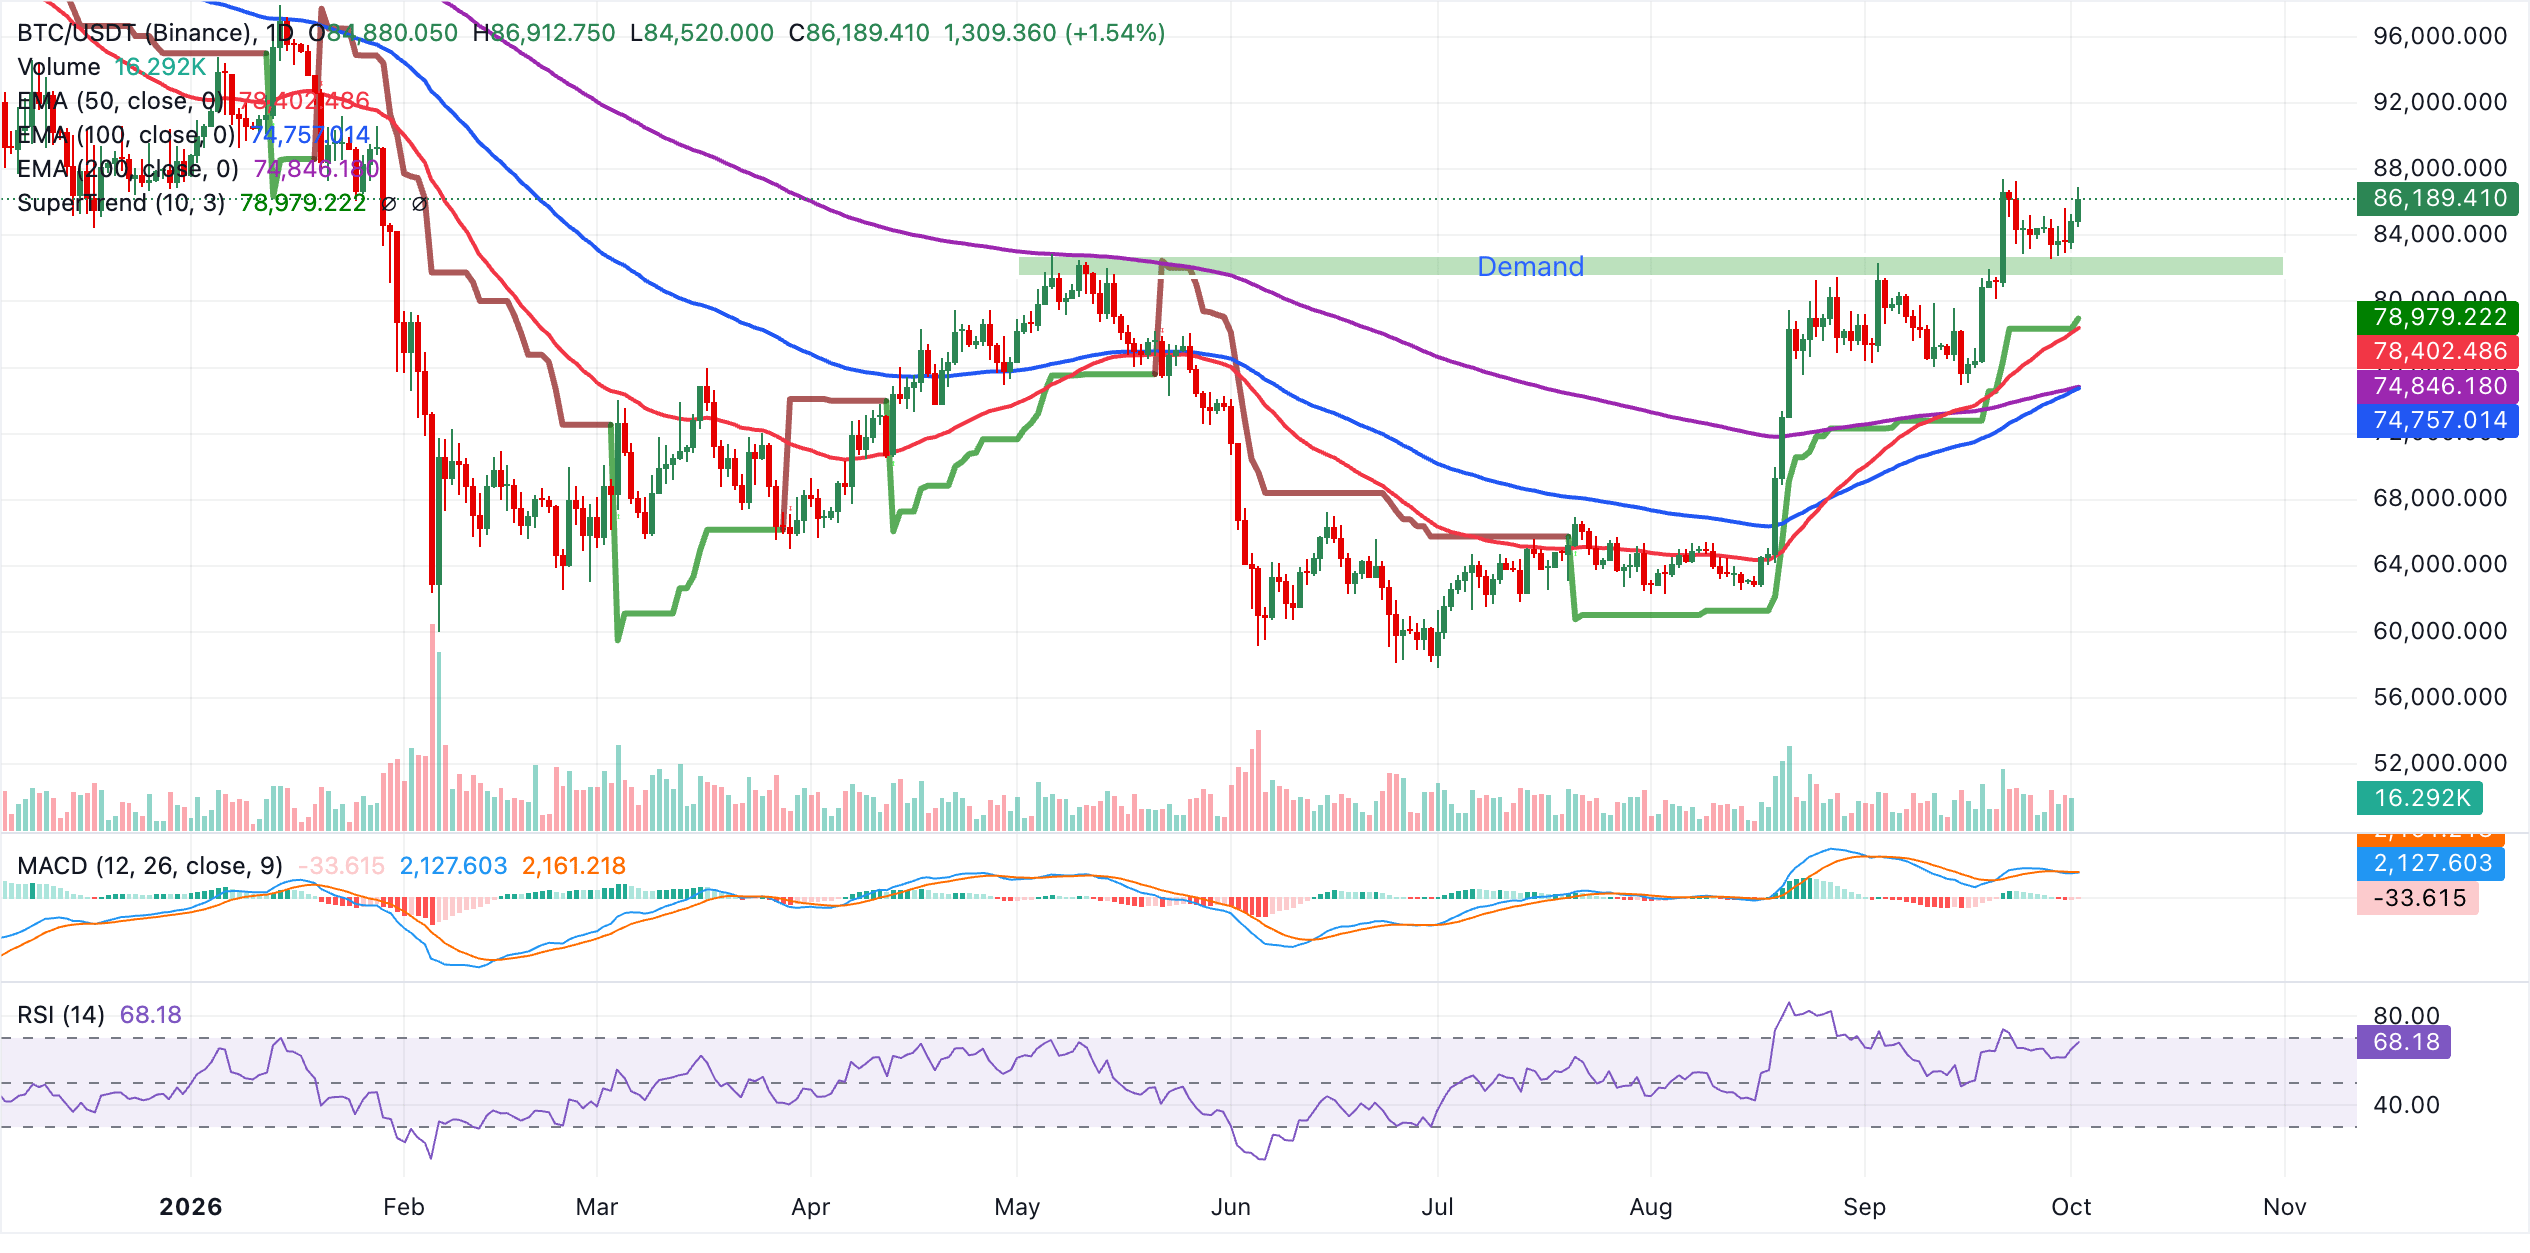
On the downside, initial support is seen around the SuperTrend line at $78,979, closely followed by the 50-day EMA at $78,402, defining the first demand cluster where dip-buying interest could emerge. Below that zone, the 200-day EMA at $74,846 and the 100-day EMA at $74,757 provide a deeper structural floor that would need to break to seriously challenge the prevailing bullish bias.
With no immediate technical resistance levels overhead in the current dataset, price action could remain biased to the topside as long as BTC holds above these stacked moving averages and trend support.
"Bitcoin spent much of the week consolidating after an exceptionally strong third quarter, but recent price action suggests the market is encountering meaningful supply in the $87,000 region. After briefly challenging that area, BTC has since slipped back below the $86,000 handle," Crypto Finance added.
Altcoins technical analysis: Ethereum and XRP build bullish momentum
Ethereum trades at $2,753, extending its advance firmly above the key EMAs. Price holds well over the 50-day EMA at $2,469, the 100-day EMA at $2,300 and the 200-day EMA at $2,268, which collectively reinforce a bullish near-term bias. The SuperTrend indicator at $2,476 also sits beneath spot, underscoring a constructive trend backdrop, while the RSI at 67 hovers near the overbought threshold, hinting at strong but stretched upside momentum.
The MACD indicator remains slightly below zero with a modestly negative reading, suggesting that, despite the prevailing uptrend, upside could be prone to intermittent pauses.
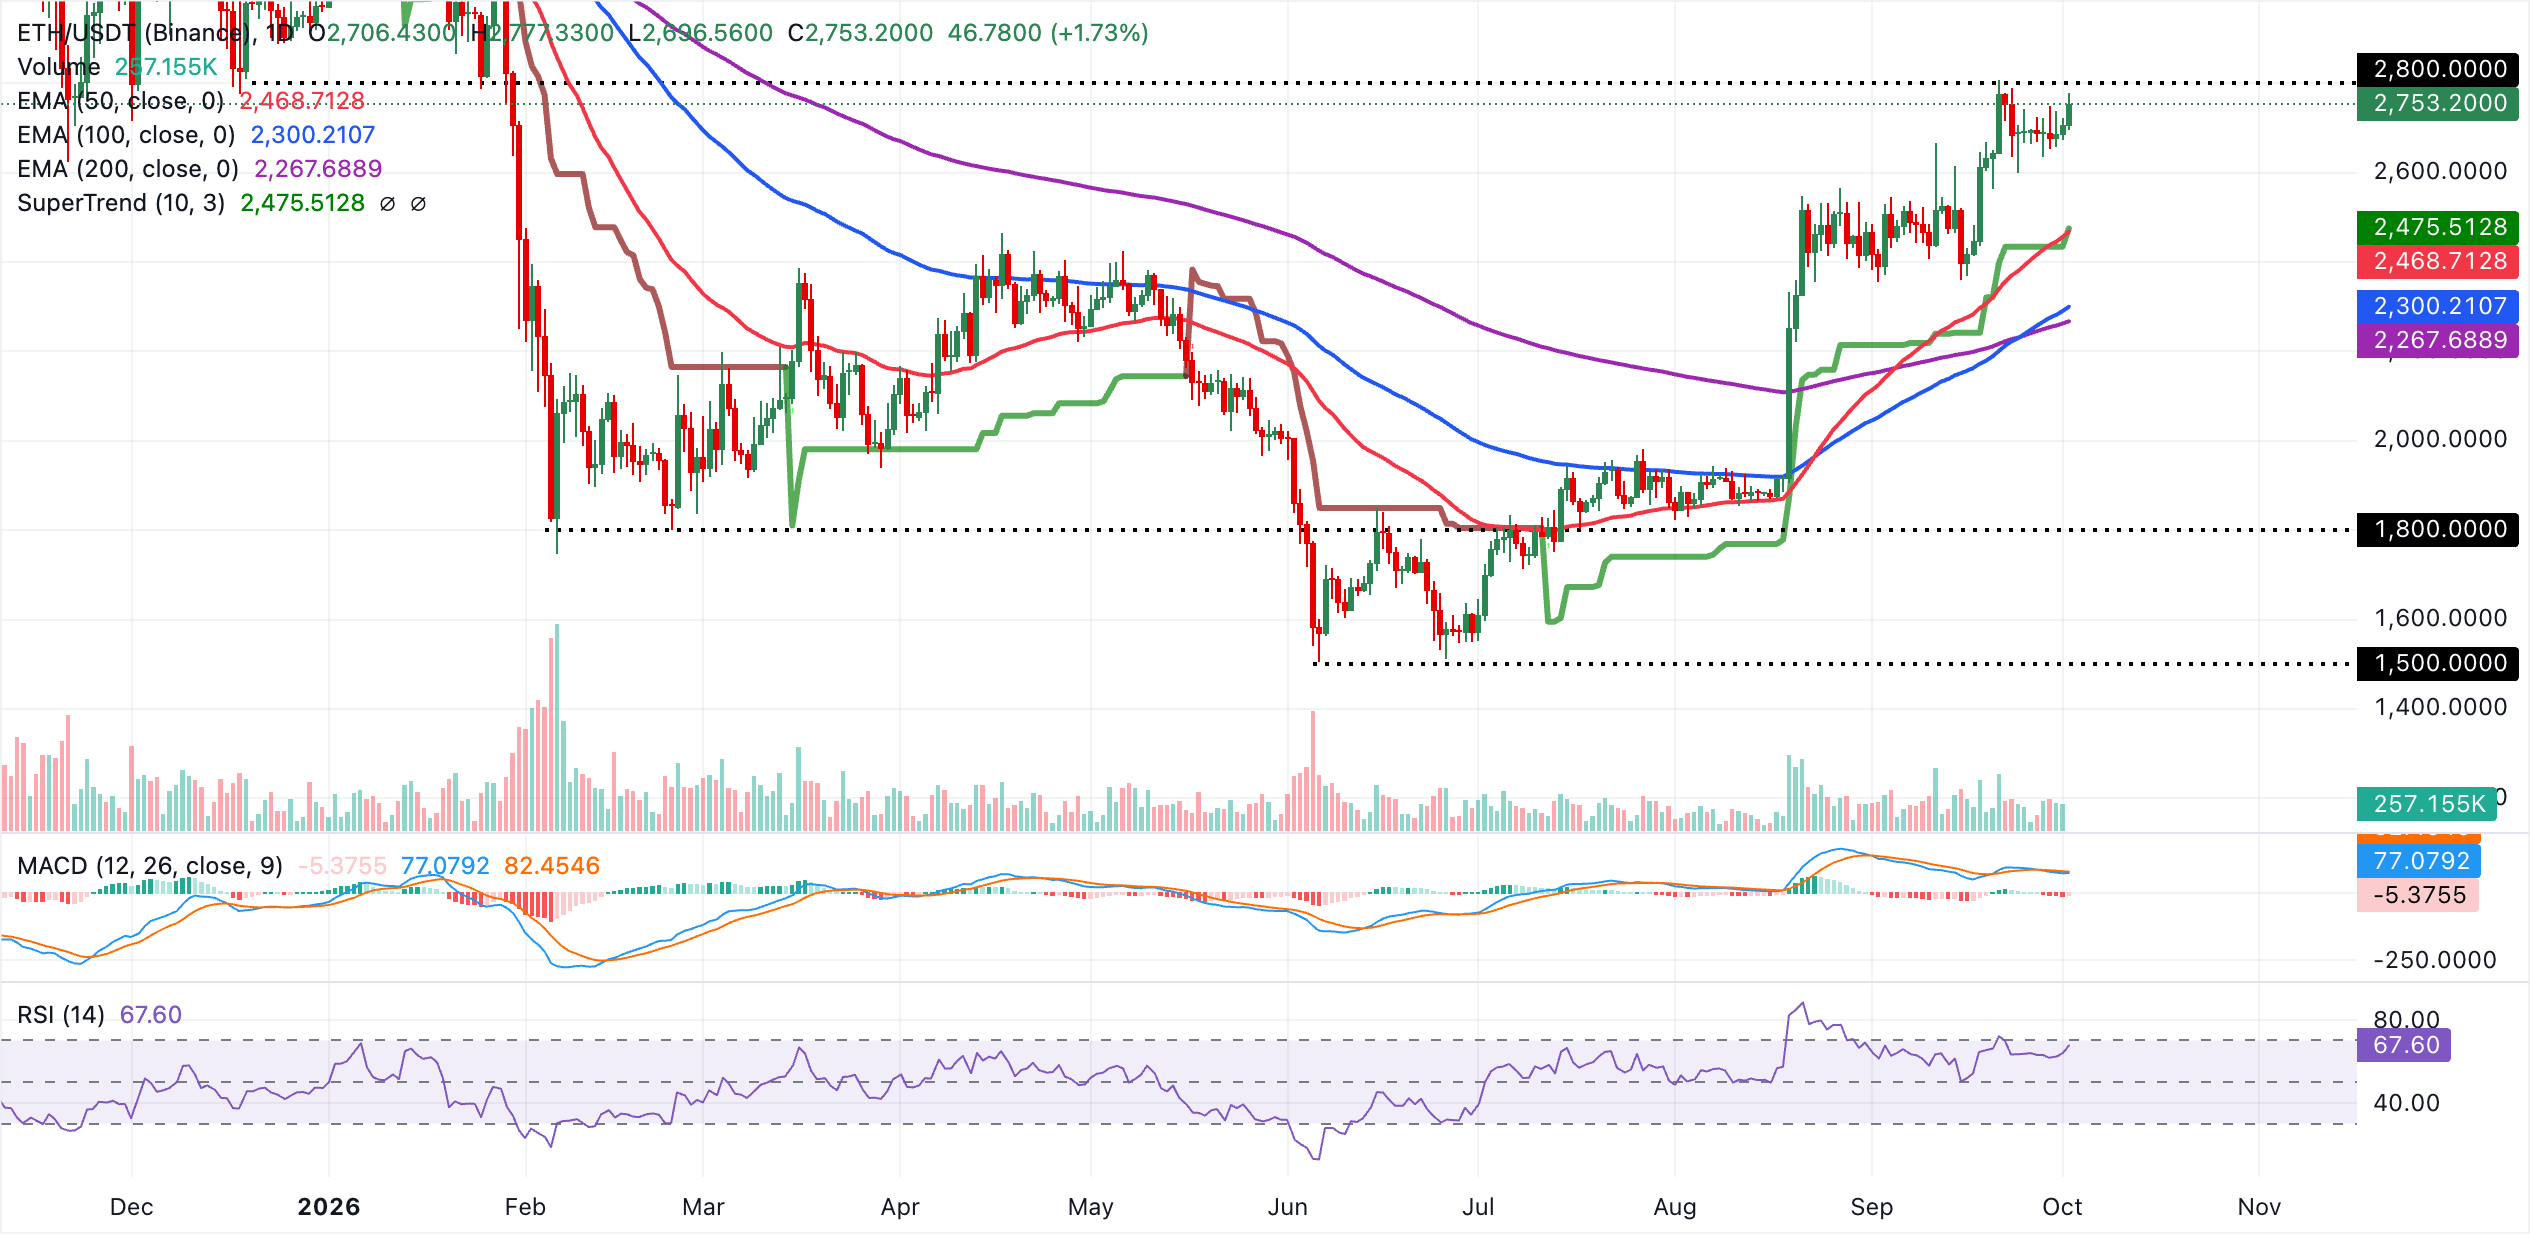
Immediate support lies at the recent price pivot near $2,753, with stronger underlying demand emerging from a dense cluster between the SuperTrend level at $2,476 and the 50-day EMA at $2,469. Below that, the 100-day EMA at $2,300 and the 200-day EMA at $2,268 form a deeper structural floor that should attract buyers on a more pronounced correction.
With no clear overhead resistance defined by the monitored indicators on the daily chart, the pair would likely continue to probe higher as long as it holds above the $2,475-$2,470 support band, although the elevated RSI warns that the rally could consolidate or briefly unwind before extending further.
XRP, meanwhile, trades higher near $1.54, while the pair holds well above the upward-sloping EMAs, with the 50-day EMA near $1.38 and the 200-day EMA at $1.37 reinforcing a constructive bullish bias after reclaiming the former trendline break level around $1.40.
The SuperTrend line at $1.28 remains far below price, underscoring a wide cushion for the current advance, while the RSI near 60 suggests bullish momentum without yet reaching overbought territory, even as the MACD indicator shows a slight loss of upside traction as the line dips marginally negative.
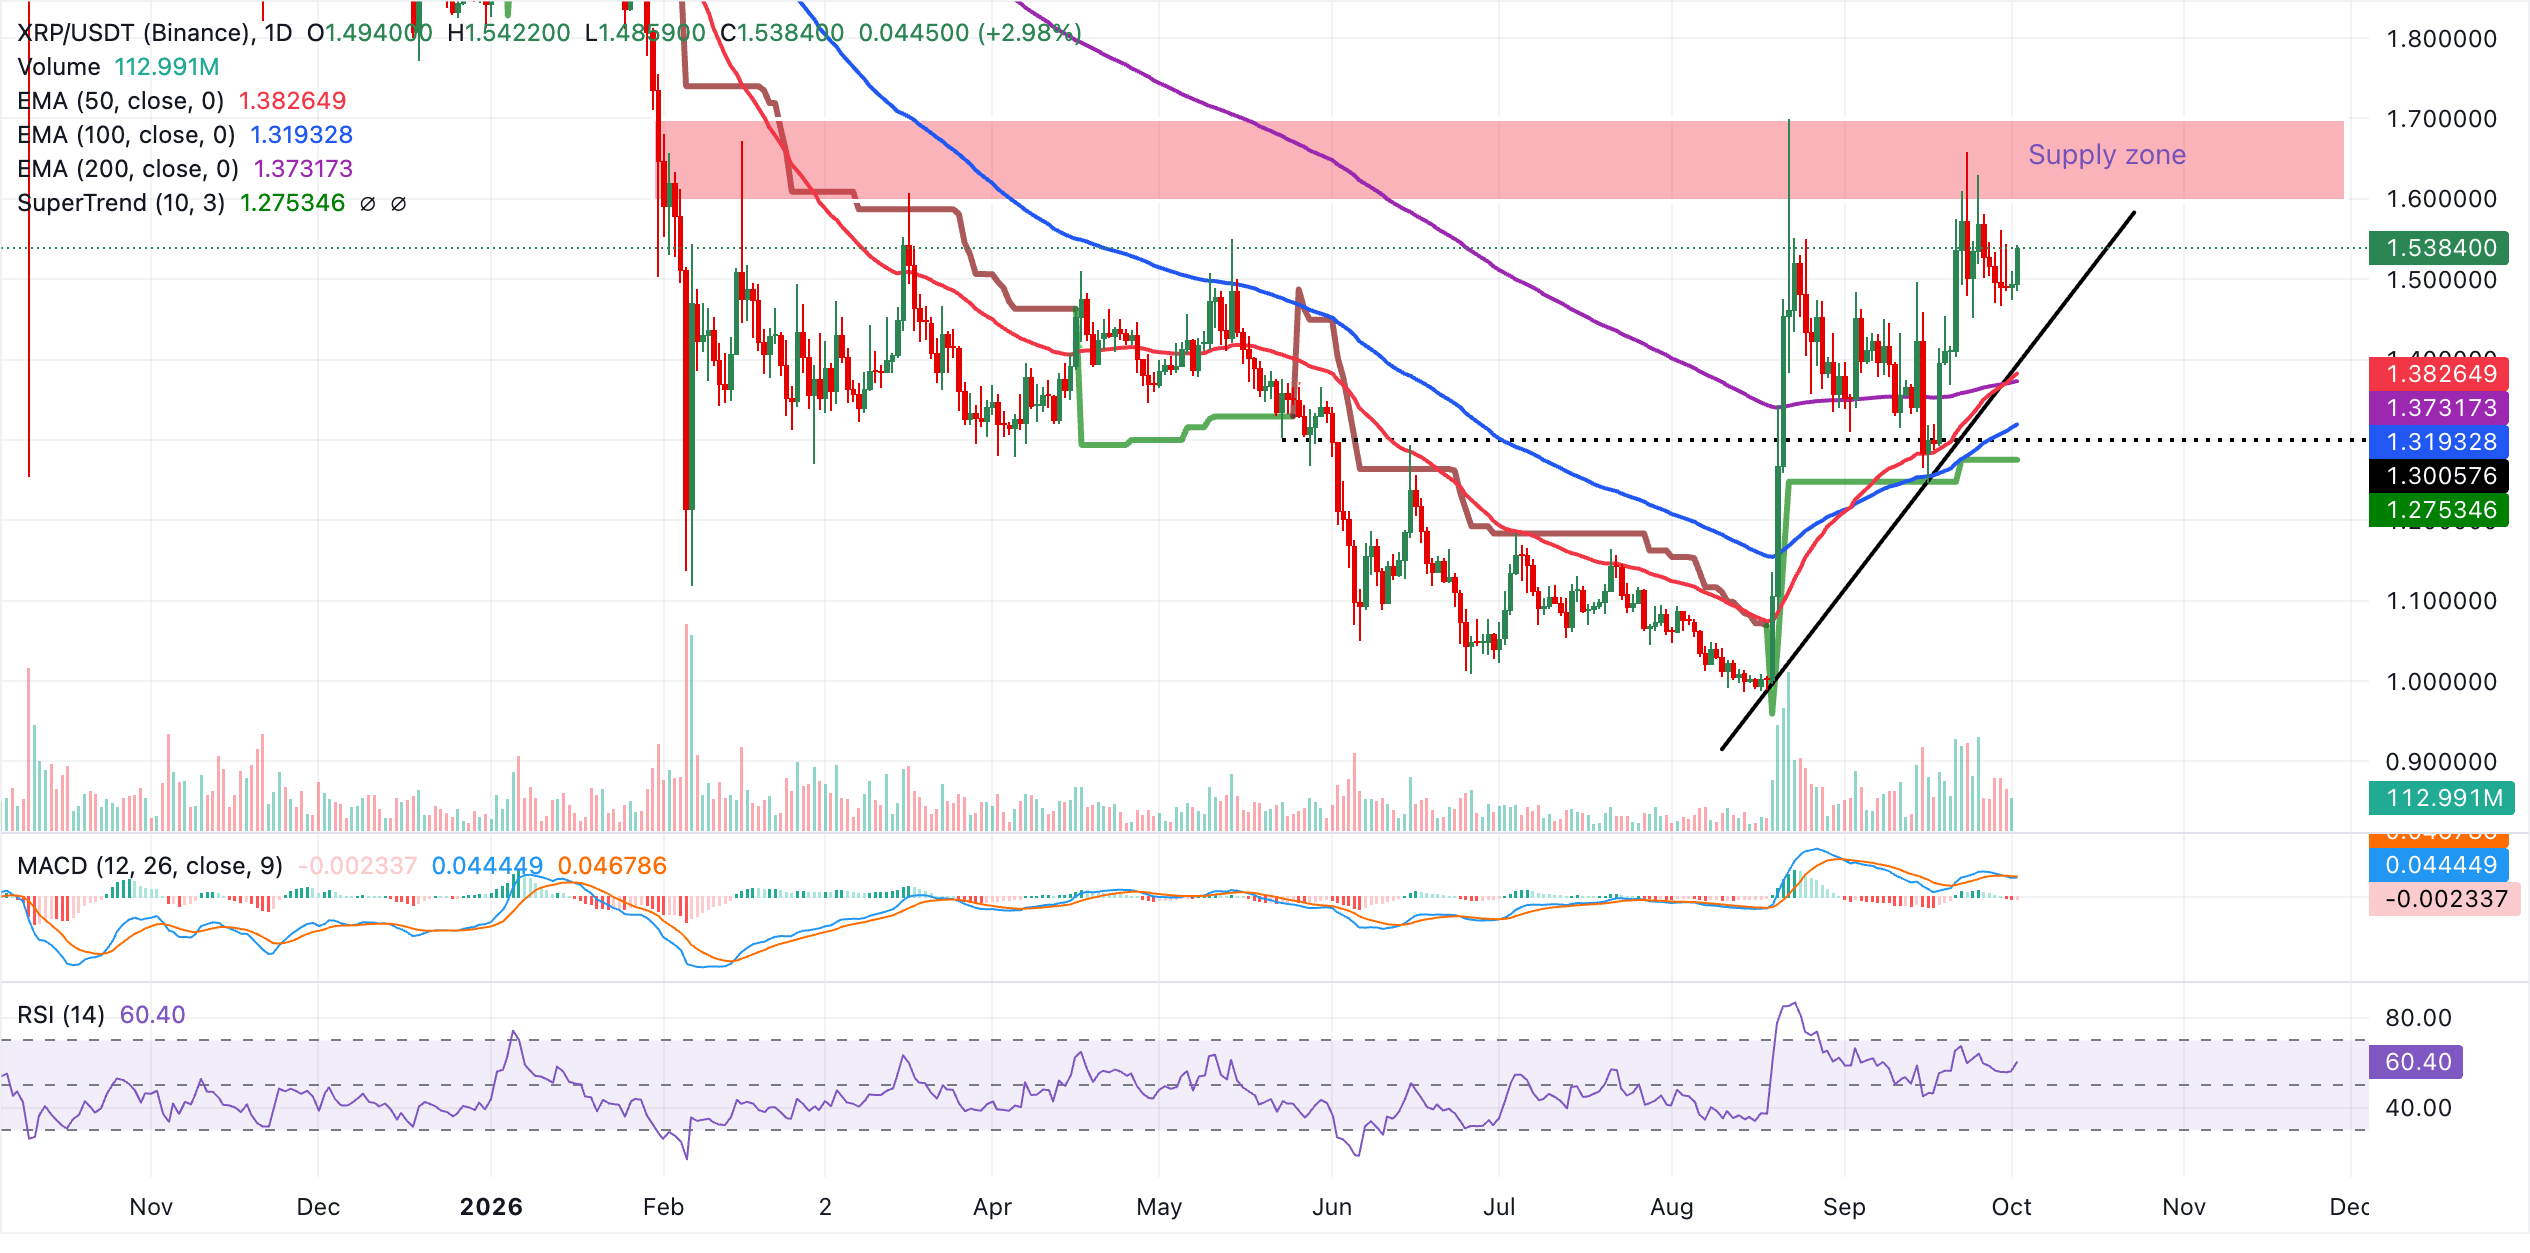
Initial support lies at the recent breakout area around $1.40, followed by a dense technical cluster formed by the 50-day EMA at $1.38 and the 200-day EMA at $1.37, where buyers could attempt to defend the broader uptrend. Deeper pullbacks would expose the 100-day EMA at $1.32 and the SuperTrend signal line at $1.28 as subsequent demand layers, keeping the overall structure bullish as long as price holds above these levels, even if near-term consolidation develops after the latest surge.
(The technical analysis of this story was written with the help of an AI tool. Know more.)
Bitcoin, altcoins, stablecoins FAQs
Bitcoin is the largest cryptocurrency by market capitalization, a virtual currency designed to serve as money. This form of payment cannot be controlled by any one person, group, or entity, which eliminates the need for third-party participation during financial transactions.
Altcoins are any cryptocurrency apart from Bitcoin, but some also regard Ethereum as a non-altcoin because it is from these two cryptocurrencies that forking happens. If this is true, then Litecoin is the first altcoin, forked from the Bitcoin protocol and, therefore, an “improved” version of it.
Stablecoins are cryptocurrencies designed to have a stable price, with their value backed by a reserve of the asset it represents. To achieve this, the value of any one stablecoin is pegged to a commodity or financial instrument, such as the US Dollar (USD), with its supply regulated by an algorithm or demand. The main goal of stablecoins is to provide an on/off-ramp for investors willing to trade and invest in cryptocurrencies. Stablecoins also allow investors to store value since cryptocurrencies, in general, are subject to volatility.
Bitcoin dominance is the ratio of Bitcoin's market capitalization to the total market capitalization of all cryptocurrencies combined. It provides a clear picture of Bitcoin’s interest among investors. A high BTC dominance typically happens before and during a bull run, in which investors resort to investing in relatively stable and high market capitalization cryptocurrency like Bitcoin. A drop in BTC dominance usually means that investors are moving their capital and/or profits to altcoins in a quest for higher returns, which usually triggers an explosion of altcoin rallies.
Artículos destacados
1Euro hits fresh two-month lows against British Pound after hot Eurozone inflation data2Australian Dollar trades higher against US Dollar ahead of US NFP data3Swiss Franc emerges as a safe-haven as global bonds sell off4Dogecoin Price Forecast: DOGE eyes $0.10 breakout as broader crypto market recovers5Euro: Downside risks despite ECB scope – BBH6Euro underperforms as France fiscal risks mount7Crypto Today: Bitcoin, Ethereum and XRP gains reinforce bullish outlook8France: Budget strains weigh on outlook – BBH9Euro-area Inflation: Headline pressures rise – Nordea
COTIZACIONES EN VIVO


TODO SOBRE TECHNICAL
What Is ICT Trading? Inner Circle Trader Concepts Explained
Support and Resistance: Meaning, Types, How to Draw Levels & Trading Strategies
What Is Liquidity? Meaning in Trading and Financial Markets
Liquidity Sweep: Meaning, Examples & Trading Strategy
Market Structure in Trading: The Complete Guide (Bullish, Bearish, Sideways)
Change of Character (CHoCH): Definition, Examples & Strategy
What Is the Bullish Kicker Pattern and How to Trade It?
What Is a Dragonfly Doji Candlestick and How Do You Trade It?
What Is an Inverted Hammer Candlestick Pattern and How Do You Trade It?
¡Comience ahora!
Regístrese y acceda a los mercados globales en menos de 3 minutos

Conéctese con nosotros









Contactos
Teléfono: +61 2 8036 8388
Fax: +61 2 8036 8388
Correo electrónico: support@tmgm.com
Web: https://www.tmgm.com



La información proporcionada en este sitio web es únicamente de carácter general y no constituye asesoramiento financiero personal. Antes de actuar sobre cualquier información de este sitio web, debe considerar la idoneidad de la información en relación con sus objetivos, situación financiera y necesidades. Invertir en CFD y contratos de margen de FX conlleva riesgos significativos y no es adecuado para todos los inversores. Puede perder más que su depósito inicial. Usted no posee ni tiene ningún interés en el activo subyacente. Le recomendamos que busque asesoramiento independiente y se asegure de comprender plenamente los riesgos involucrados antes de operar. Es importante que lea y considere el documento de divulgación antes de adquirir cualquier producto listado en el sitio web. La información y los anuncios ofrecidos en este sitio web no están destinados al uso por parte de ninguna persona en ningún país o jurisdicción donde dicho uso sea contrario a las leyes y regulaciones locales. Los productos y servicios ofrecidos en este sitio web no están destinados a residentes de Estados Unidos, Malasia y Tailandia.
TMGM está autorizado y regulado en varias jurisdicciones.
Trademax Australia Limited, que opera como TMGM, está regulada por la Comisión Australiana de Valores e Inversiones (ASIC), AFSL n.º 436416, y está ubicada en Level 28, One International Tower, 100 Barangaroo Avenue, 2000 Sydney, NSW Australia.
Correo electrónico: support@tmgm.com.au
Trademax Global Limited, que opera como TMGM, está autorizada y regulada por la Comisión de Servicios Financieros de Vanuatu (VFSC), número de registro 40356, y está registrada en 1276, Kumul Highway, Port Vila, Vanuatu, República de Vanuatu.
Correo electrónico: support@tmgm.com
Trademax Global Markets (SE) Limited, que opera como TMGM, está autorizada y regulada por la Autoridad de Servicios Financieros (FSA) de Seychelles, con número de licencia SD224. La empresa está registrada en Office No 13, Providence Estate ABIS Centre, Mahe, Seychelles.
Correo electrónico: support@tmgm.com
Trademax Global Markets (International) Pty Ltd, que opera como TMGM, está autorizada y regulada por la Comisión de Servicios Financieros de Mauricio (FSC) con licencia n.º GB22201012, y está registrada en 33, Edith Cavell Street C/o IQ EQ Fund Services (Mauritius) Ltd Port Louis, 11324 Mauricio.
Correo electrónico: support@tmgm.com
Copyright © TMGM. Todos los derechos reservados