

EUR/USD Price Forecast: Holds key 100-day SMA at start of the US CPI week
- EUR/USD edges down to near 1.1610 as investors turn cautious at the start of the US CPI week.
- Market experts expect the US CPI data to significantly influence Fed’s interest rate expectations.
- The US NFP data for August beats estimates by a wide margin.
The Euro (EUR) trades marginally lower at around 1.1610 against the US Dollar (USD) during the Asian trading session on Monday. The major currency pair edges down as the US Dollar ticks up, with investors turning cautious at the start of the United States (US) Consumer Price Index (CPI) week.

Investors will pay close attention to the US CPI data, which will be released on Friday, to get fresh cues regarding the Federal Reserve’s (Fed) monetary policy outlook.
Markets focus on final US inflation prints before Fed decision
Analysts at Deutsche Bank stress that “all eyes will be on the August US CPI print on Friday, preceded by the PPI on Thursday,” noting that these releases represent “the last set of inflation readings before the Fed’s next decision on September 16.” Their US economists expect a notable pickup in price pressures, with August’s headline CPI forecast “to come in at +0.38% MoM vs. +0.07% previously,” while they see underlying pressures remaining contained as core CPI is projected “to print +0.21% vs. +0.22%.”
Meanwhile, traders are expected to reassess Fed interest rate expectations soon as the US Nonfarm Payrolls (NFP) data for August has come in stronger-than-expected. The data showed on Friday that the economy created 162K fresh jobs, significantly higher than 56K estimates.
EUR/USD Technical Analysis
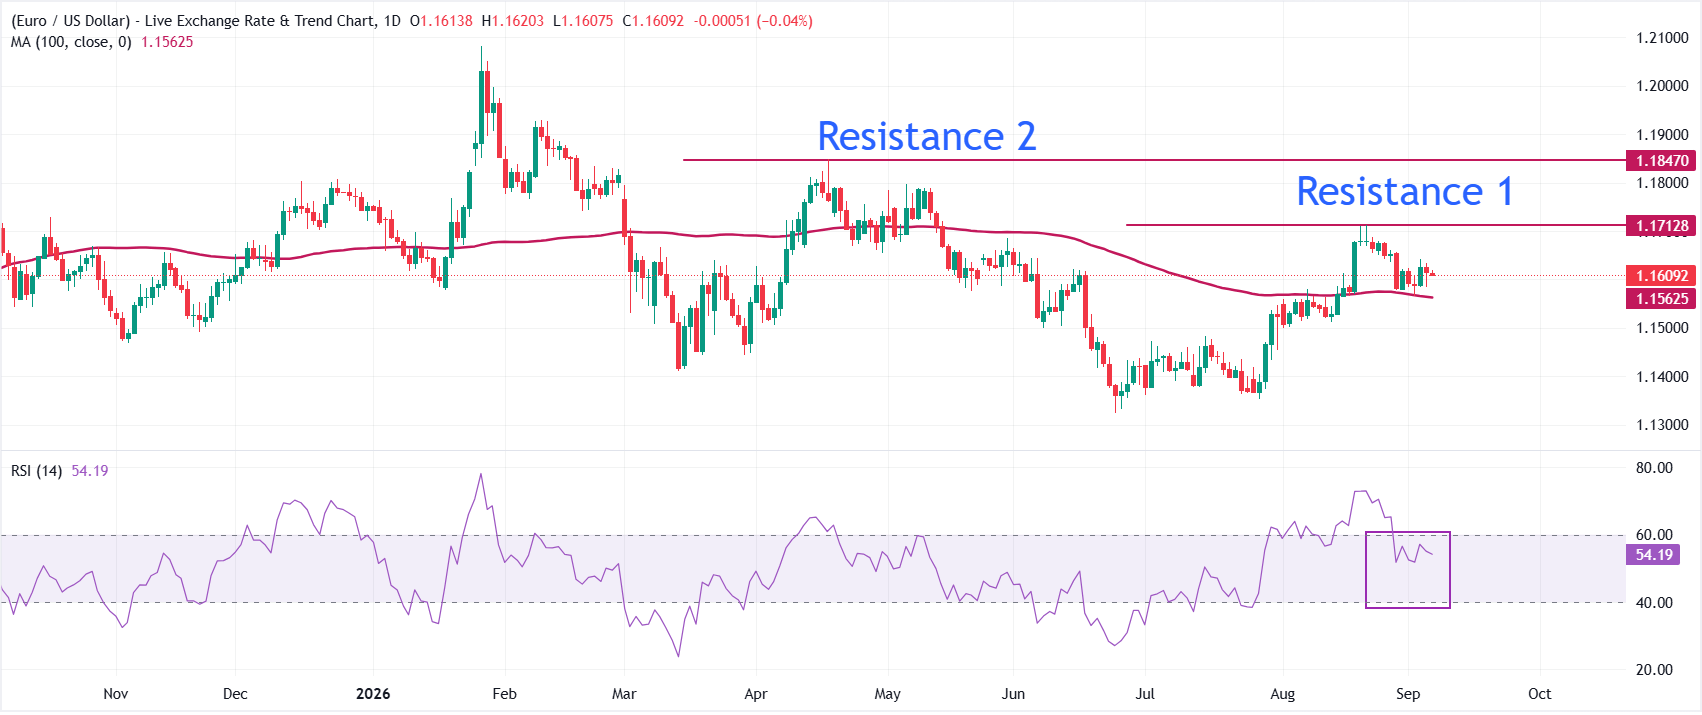
In the daily chart, EUR/USD trades at 1.1609, keeping a mildly bearish near-term tone as it holds beneath the 100-day Simple Moving Average (SMA) at 1.1563, which now acts as an overhead cap. The Relative Strength Index (RSI) at roughly 54 stays in neutral territory, hinting that downside pressure persists but without strong momentum exhaustion signals on either side.
On the topside, the 100-day SMA at 1.1563 is the first notable resistance that bulls would need to reclaim to ease the current capped structure and reopen the path toward higher levels. With no clear nearby support levels from major moving averages or structural indicators below price in this dataset, any slide back toward recent lows would likely be driven more by momentum and broader market flows than by well-defined technical floors on this timeframe.
(The technical analysis of this story was written with the help of an AI tool. Know more.)
Inflation FAQs
Inflation measures the rise in the price of a representative basket of goods and services. Headline inflation is usually expressed as a percentage change on a month-on-month (MoM) and year-on-year (YoY) basis. Core inflation excludes more volatile elements such as food and fuel which can fluctuate because of geopolitical and seasonal factors. Core inflation is the figure economists focus on and is the level targeted by central banks, which are mandated to keep inflation at a manageable level, usually around 2%.
The Consumer Price Index (CPI) measures the change in prices of a basket of goods and services over a period of time. It is usually expressed as a percentage change on a month-on-month (MoM) and year-on-year (YoY) basis. Core CPI is the figure targeted by central banks as it excludes volatile food and fuel inputs. When Core CPI rises above 2% it usually results in higher interest rates and vice versa when it falls below 2%. Since higher interest rates are positive for a currency, higher inflation usually results in a stronger currency. The opposite is true when inflation falls.
Although it may seem counter-intuitive, high inflation in a country pushes up the value of its currency and vice versa for lower inflation. This is because the central bank will normally raise interest rates to combat the higher inflation, which attract more global capital inflows from investors looking for a lucrative place to park their money.
Formerly, Gold was the asset investors turned to in times of high inflation because it preserved its value, and whilst investors will often still buy Gold for its safe-haven properties in times of extreme market turmoil, this is not the case most of the time. This is because when inflation is high, central banks will put up interest rates to combat it. Higher interest rates are negative for Gold because they increase the opportunity-cost of holding Gold vis-a-vis an interest-bearing asset or placing the money in a cash deposit account. On the flipside, lower inflation tends to be positive for Gold as it brings interest rates down, making the bright metal a more viable investment alternative.














