

Gold comes under pressure ahead of US PPI as Fed rate hike risks linger
- Gold reverses earlier gains as the US Dollar steadies ahead of US producer inflation data.
- A hotter PPI report could strengthen expectations of a Federal Reserve rate hike next week.
- The daily chart points to neutral momentum, while XAU/USD remains capped below its 200-day SMA.
Gold (XAU/USD) trades with a downside bias on Thursday, reversing earlier gains as the US Dollar (USD) stabilizes ahead of the United States Producer Price Index (PPI) data due at 12:30 GMT. At the time of writing, XAU/USD trades around $4,383 after reaching an intraday high of $4,434.

Economists expect US producer inflation to pick up again in August. The headline PPI is forecast to rise 0.4% on a monthly basis after remaining unchanged in July, while the annual rate is expected to accelerate to 5.3% from 4.7%. Core PPI, which excludes volatile food and energy prices, is expected to rise 0.3% MoM, up from 0.2%. On an annual basis, core producer inflation is forecast to rise to 4.6% from 4.2%.
Rising Oil prices are already adding to inflation concerns, so a stronger-than-expected PPI reading could further reinforce expectations that the Federal Reserve (Fed) will raise interest rates at its September 15-16 meeting. However, Friday’s US Consumer Price Index (CPI) report will likely carry greater weight in shaping the final decision.
According to the CME FedWatch Tool, traders price in around a 62% probability of a rate hike next week. However, most economists surveyed by Reuters expect the central bank to keep interest rates unchanged through the end of the year. As a non-yielding asset, Gold tends to benefit when interest rates are low, as this reduces the opportunity cost of holding the precious metal.
Strategists at DBS caution that an "energy-driven squeeze represents a harder choice, potentially requiring the Fed to contain inflation expectations while adding pressure on growth," but add that "a credible Fed response could support the USD and ease longer-term inflation concerns."
The US Dollar Index (DXY), which tracks the Greenback’s value against a basket of six major currencies, trades around 98.90, recovering from an intraday low of 98.71. Gold also faces pressure from higher US Treasury yields. The benchmark 10-year yield trades around 4.85%, near its highest level since November 2023, after the Treasury’s larger bond buyback plan failed to impress markets.
Analysts at ING reiterate a constructive stance on the US currency, stressing that they "continue to see upside risks for the dollar." They argue that, provided "front-end USD rates remain around current levels and global sentiment stays fragile," there is little "fundamental reason for persistent USD underperformance." In their view, barring any "material downside surprises" from upcoming inflation data "today or tomorrow," the backdrop should be sufficient for "DXY to return to 99.0."
In the near term, Gold remains vulnerable to rising Fed rate-hike expectations and elevated Treasury yields, while tensions in the Middle East are offering little direct support.
Technical analysis: Bears retain control below 200-day SMA
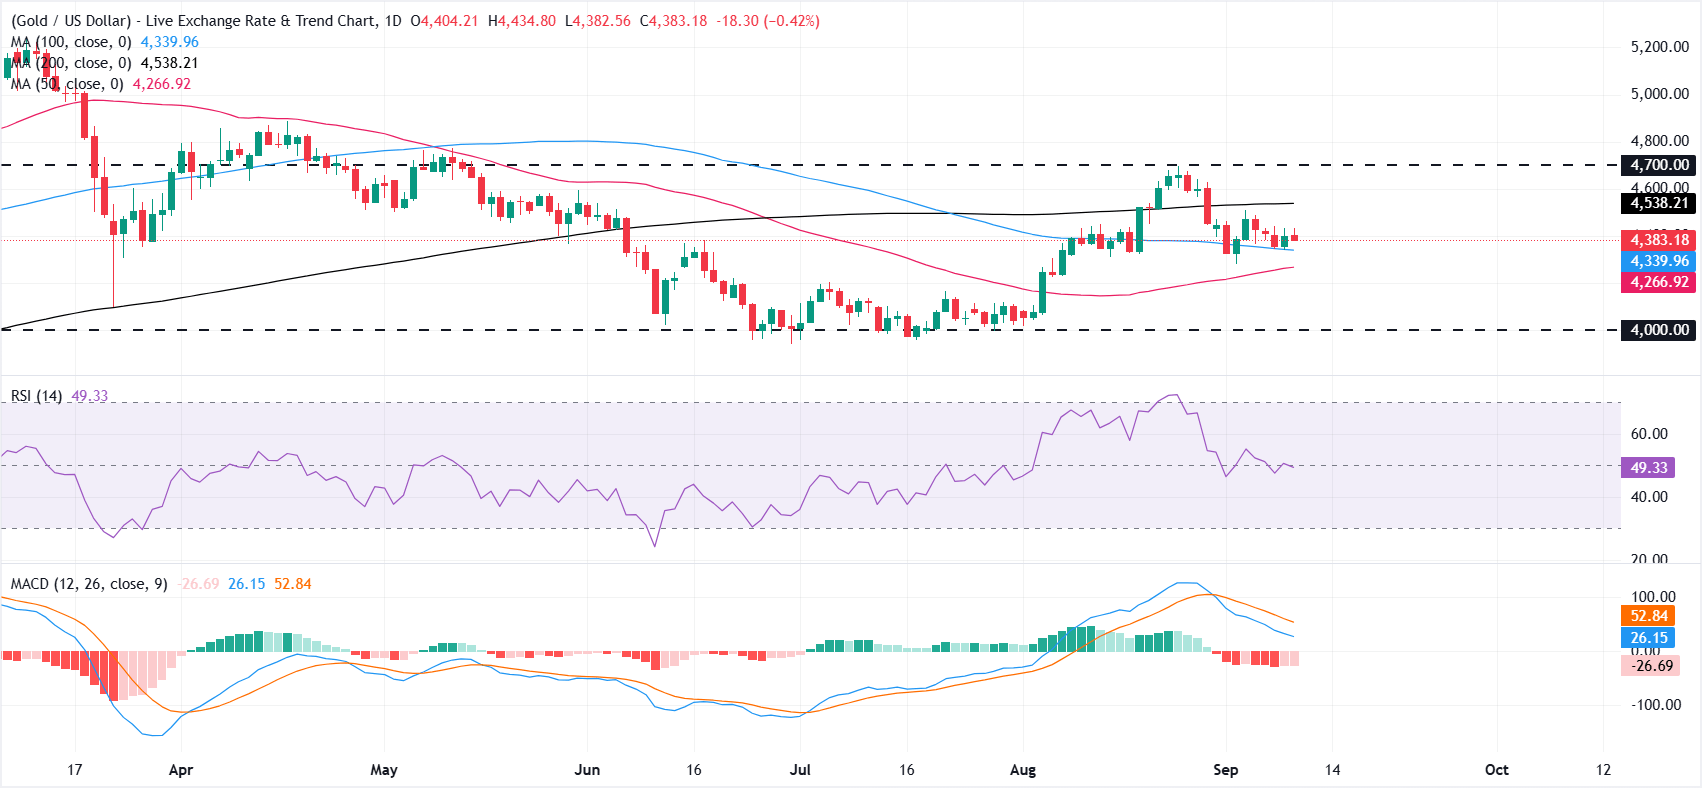
On the daily chart, XAU/USD holds above the 50-day and 100-day Simple Moving Averages (SMAs), suggesting underlying trend support, yet it remains below the 200-day SMA near $4,538, which caps the broader topside.
The Relative Strength Index (RSI) around 49 points to neutral momentum, while the Moving Average Convergence Divergence (MACD) indicator stays below zero with a negative reading and subdued histogram, hinting that rallies could still face selling pressure despite the constructive underlying structure.
On the topside, initial resistance is seen at the 200-day SMA around $4,538, with a break there exposing the next key barrier at the horizontal resistance level near $4,700. On the downside, immediate support emerges from the nearby price pivot zone around the latest close, followed by the 100-day SMA at about $4,340 and the 50-day SMA near $4,266. A deeper slide would bring the major horizontal floor at $4,000 into view as the next significant demand area.
(The technical analysis of this story was written with the help of an AI tool. Know more.)













