

Pi Network Price Forecast: Mild recovery in PI eyes key resistance breakout
- Pi Network is up nearly 2% on Friday, extending a mild recovery for the fifth consecutive day.
- The recovery in PI aligns with the broader market recovery as sentiment shifts to risk-on.
- Pi Network’s technical outlook indicates an upside bias, with bulls eyeing the $0.1000 psychological threshold.
Pi Network (PI) extends a mild recovery on Friday, marking its fifth consecutive day of trading in the green as risk appetite in the broader crypto market improves. The technical outlook for PI is mildly bullish, with bulls eyeing the $0.1000 breakout.

Crypto market’s recovery improves Pi Network recovery odds
The broader cryptocurrency market is extending its recovery so far this week, following the announcement of US Treasury long-term bond buybacks. The liquidity-support buyback increased to $4 billion, from $2 billion, lowering yields and renewing risk-on sentiment for high-risk assets.
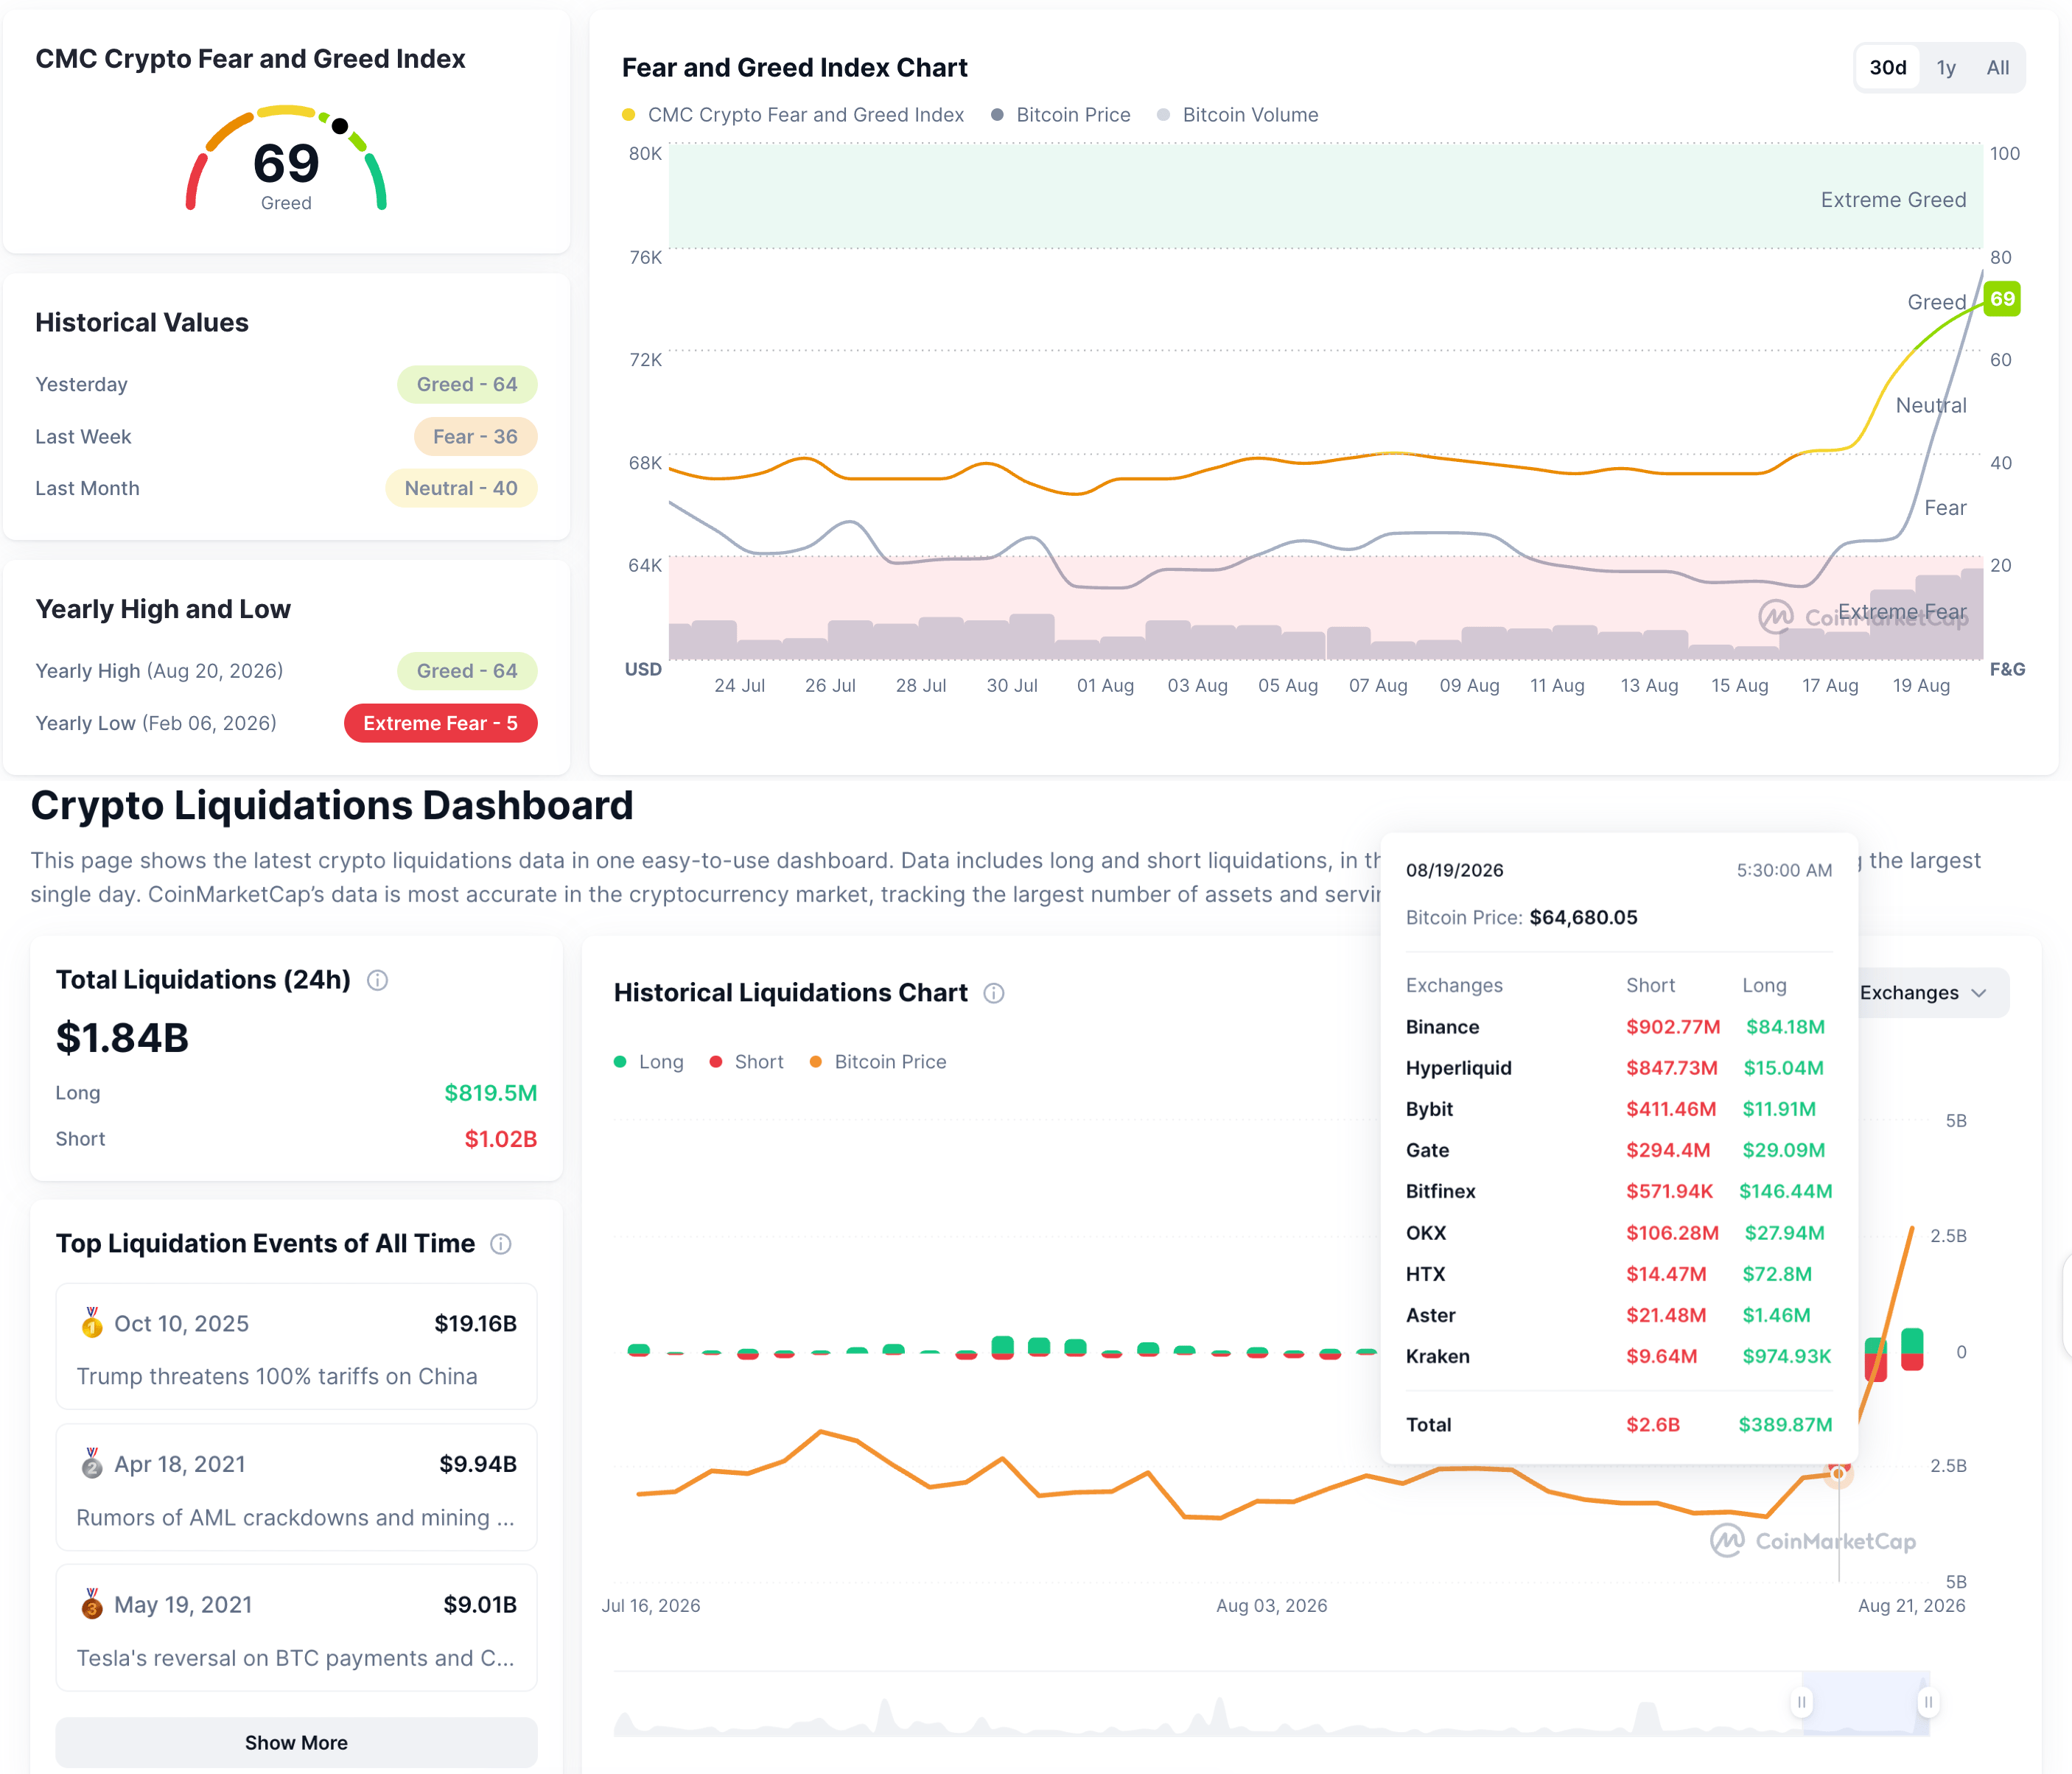
CoinMarketCap’s Fear and Greed Index at 69 on Friday suggests a firm bullish sentiment among crypto investors, increasing the odds for a rebound in altcoins. In addition, the crypto market recorded $1.84 billion in liquidations over the last 24 hours, with $1.02 billion from short positions, reaffirming persistent, firm buy-side dominance.
Technical outlook: Could PI extend its rally above $0.10?
Pi Network is up 2% on Friday, extending its early recovery for the fifth consecutive day. The price holds above the $0.0900 level, testing the bullish breakout of a short-term resistance trendline near $0.0908.
From a technical perspective, a mild recovery in Pi Network hints at a delayed follow-through of the previously broken falling channel pattern on the daily chart. The immediate resistance for Pi Network aligns with the $0.1000 psychological threshold, reinforced by the 50% retracement of the downswing from $0.1341 to $0.0703, at $0.1022.
A confirmed breakout of $0.1022 could signal a bullish trend reversal in the PI token, targeting the 78.6% retracement level at $0.1204.
Momentum on the daily chart supports the constructive tone, with the relative strength index (RSI) at 56, maintaining a positive slope above the midline as buying pressure increases. At the same time, the Moving Average Convergence Divergence (MACD) extends its upward trend toward the zero line, with the histogram remaining in positive territory, reaffirming the firm upside momentum.
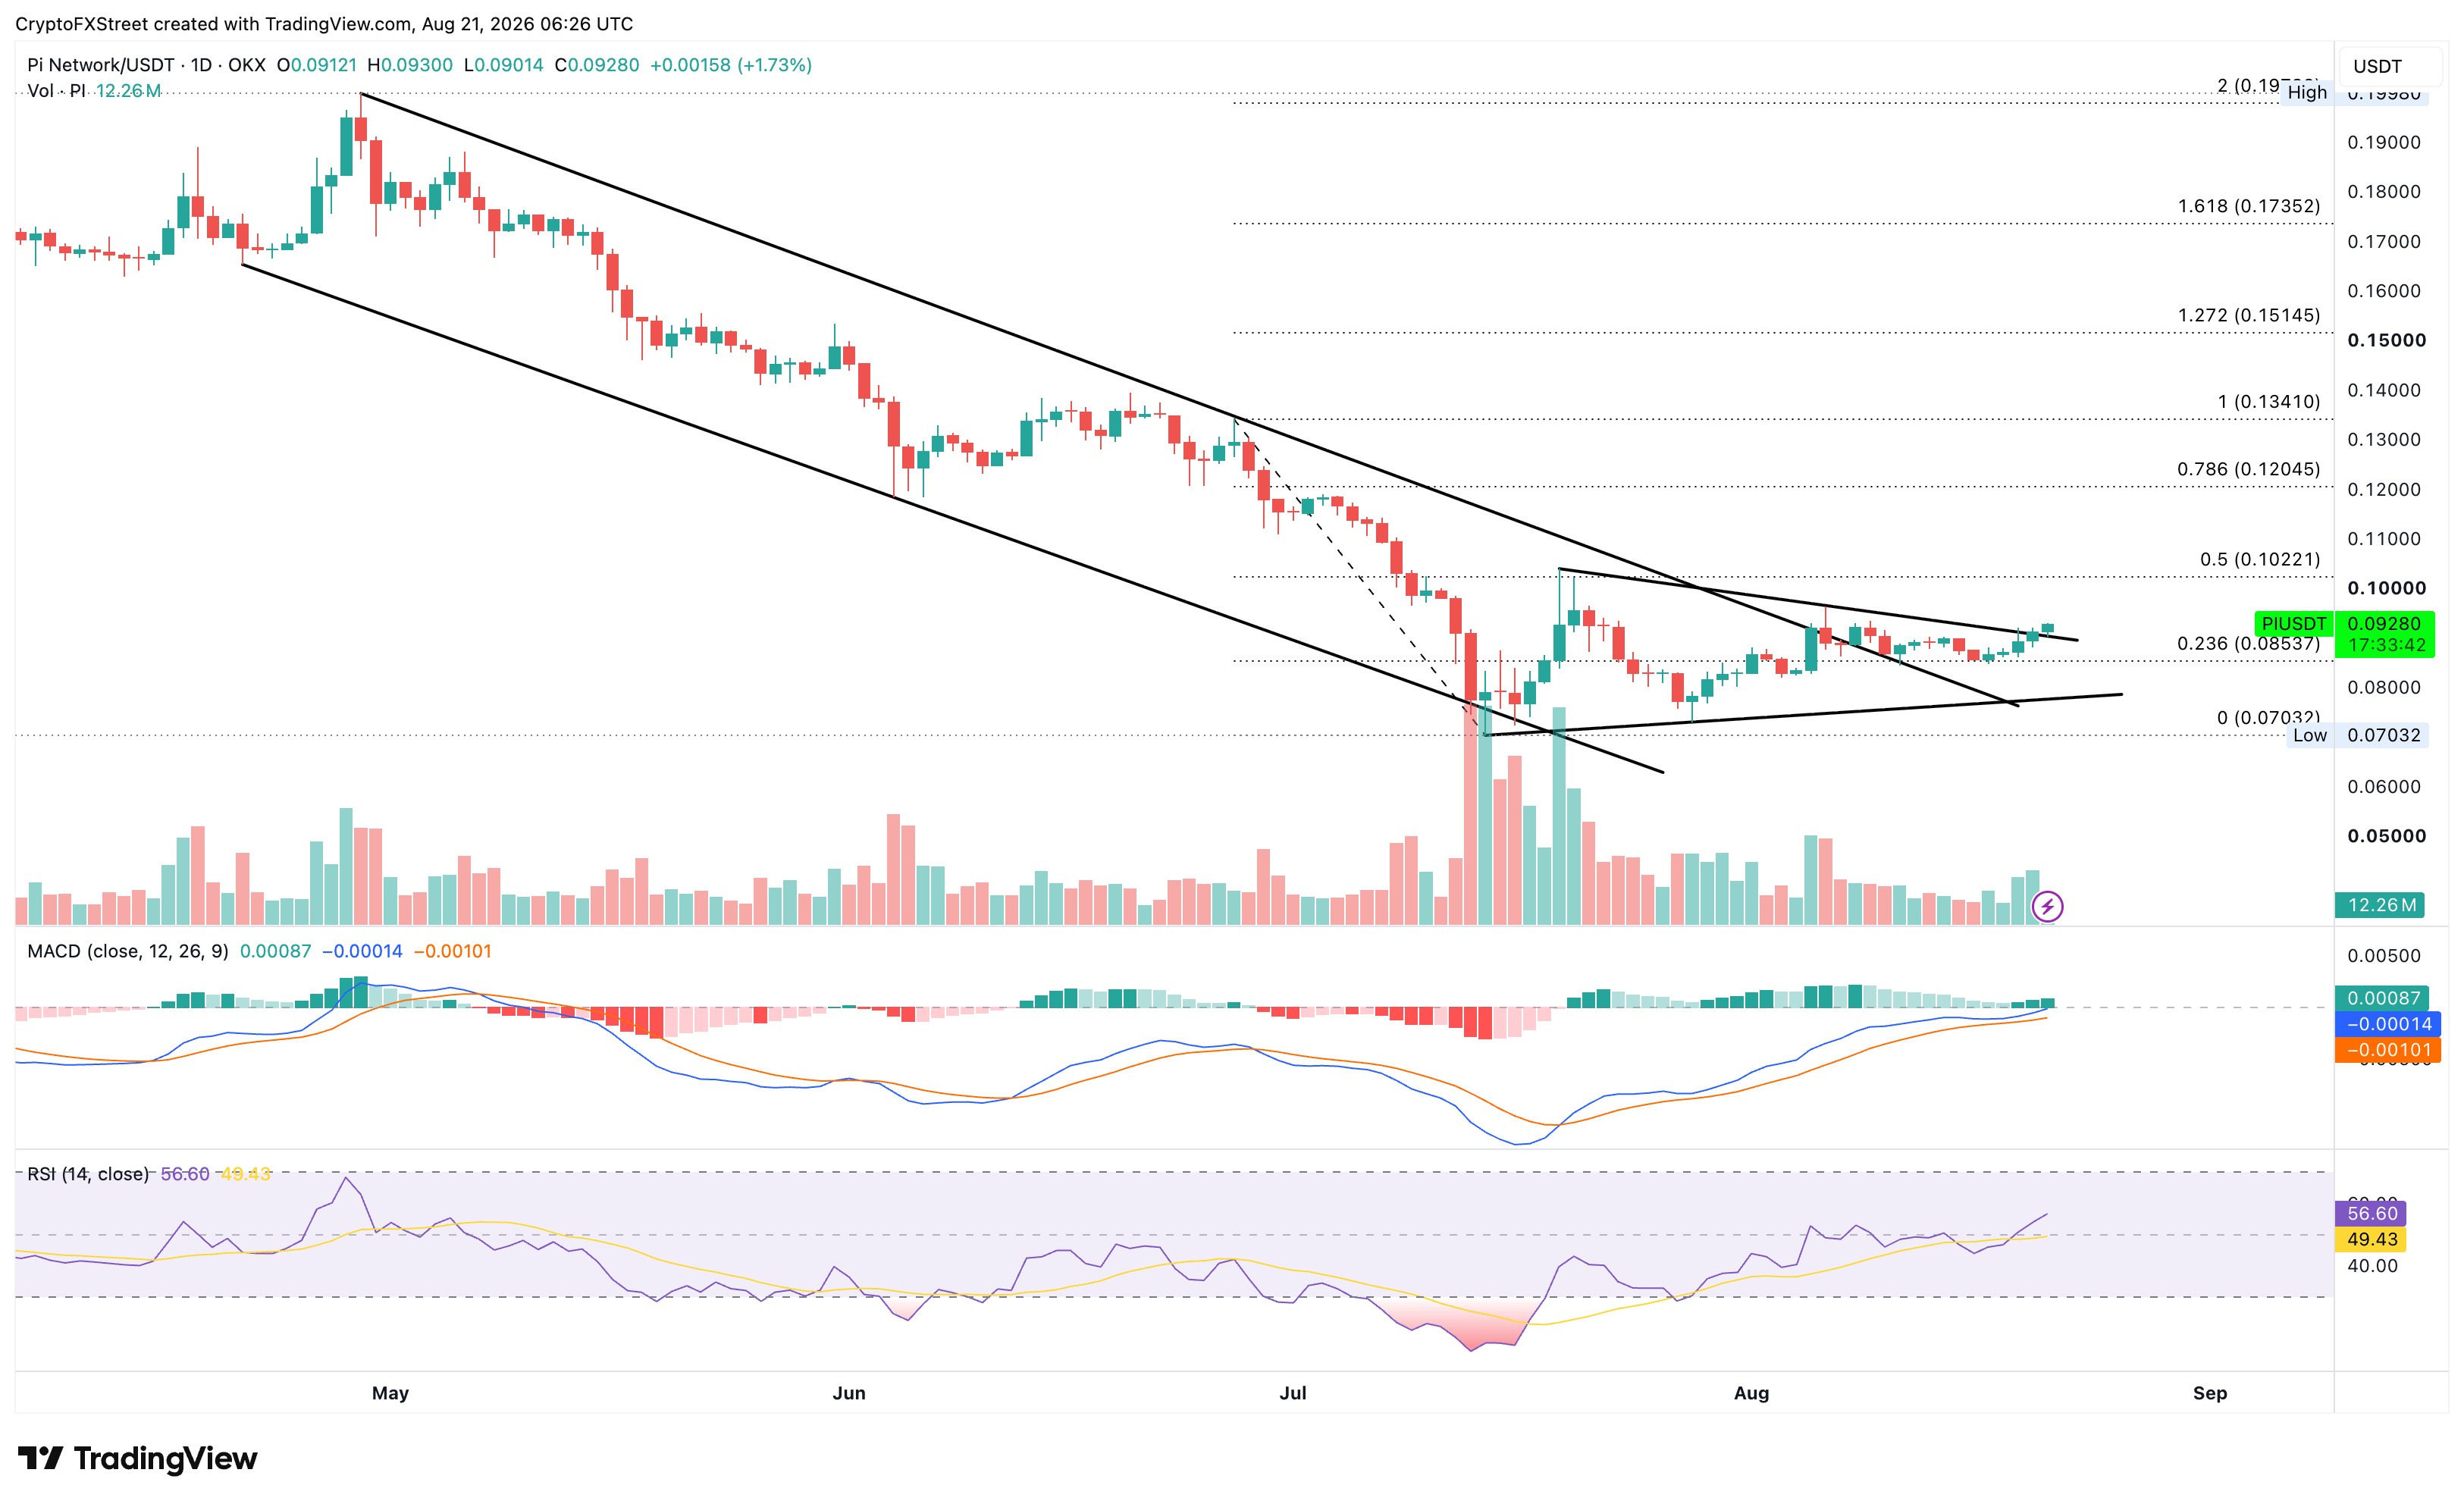
Looking down, the 23.6% Fibonacci retracement level at $0.0853 remains a key support, guarding the downside of the minor upward trend line near $0.0776.
(The technical analysis of this story was written with the help of an AI tool. Know more.)













