

Trading
Explora una amplia gama de mercados con precios competitivos, liquidez profunda y herramientas de trading avanzadas.
Más información 
Plataforma
Opera sin interrupciones con la potente plataforma de TMGM, diseñada para ofrecer velocidad, precisión y una experiencia de trading superior.
Más información Plataforma de trading
Herramientas de trading
Academia
Aprende los fundamentos del trading con recursos ideales para principiantes, incluidas guías, seminarios web y análisis del mercado.
Más información Academia TMGM
Noticias y análisis
Obtén actualizaciones del mercado en tiempo real y análisis de expertos para adelantarte a las oportunidades de trading
Más información Noticias y análisis
Acerca de
Descubre qué distingue a TMGM: nuestra presencia global, solidez regulatoria y compromiso con la innovación en el trading.
Más información Por qué elegir TMGM
Pi Network Price Forecast: PI stalls below 50-day EMA as Protocol 28 upgrade nears
- Pi Network is down roughly 3% on Monday, giving back some of last week’s 6% recovery.
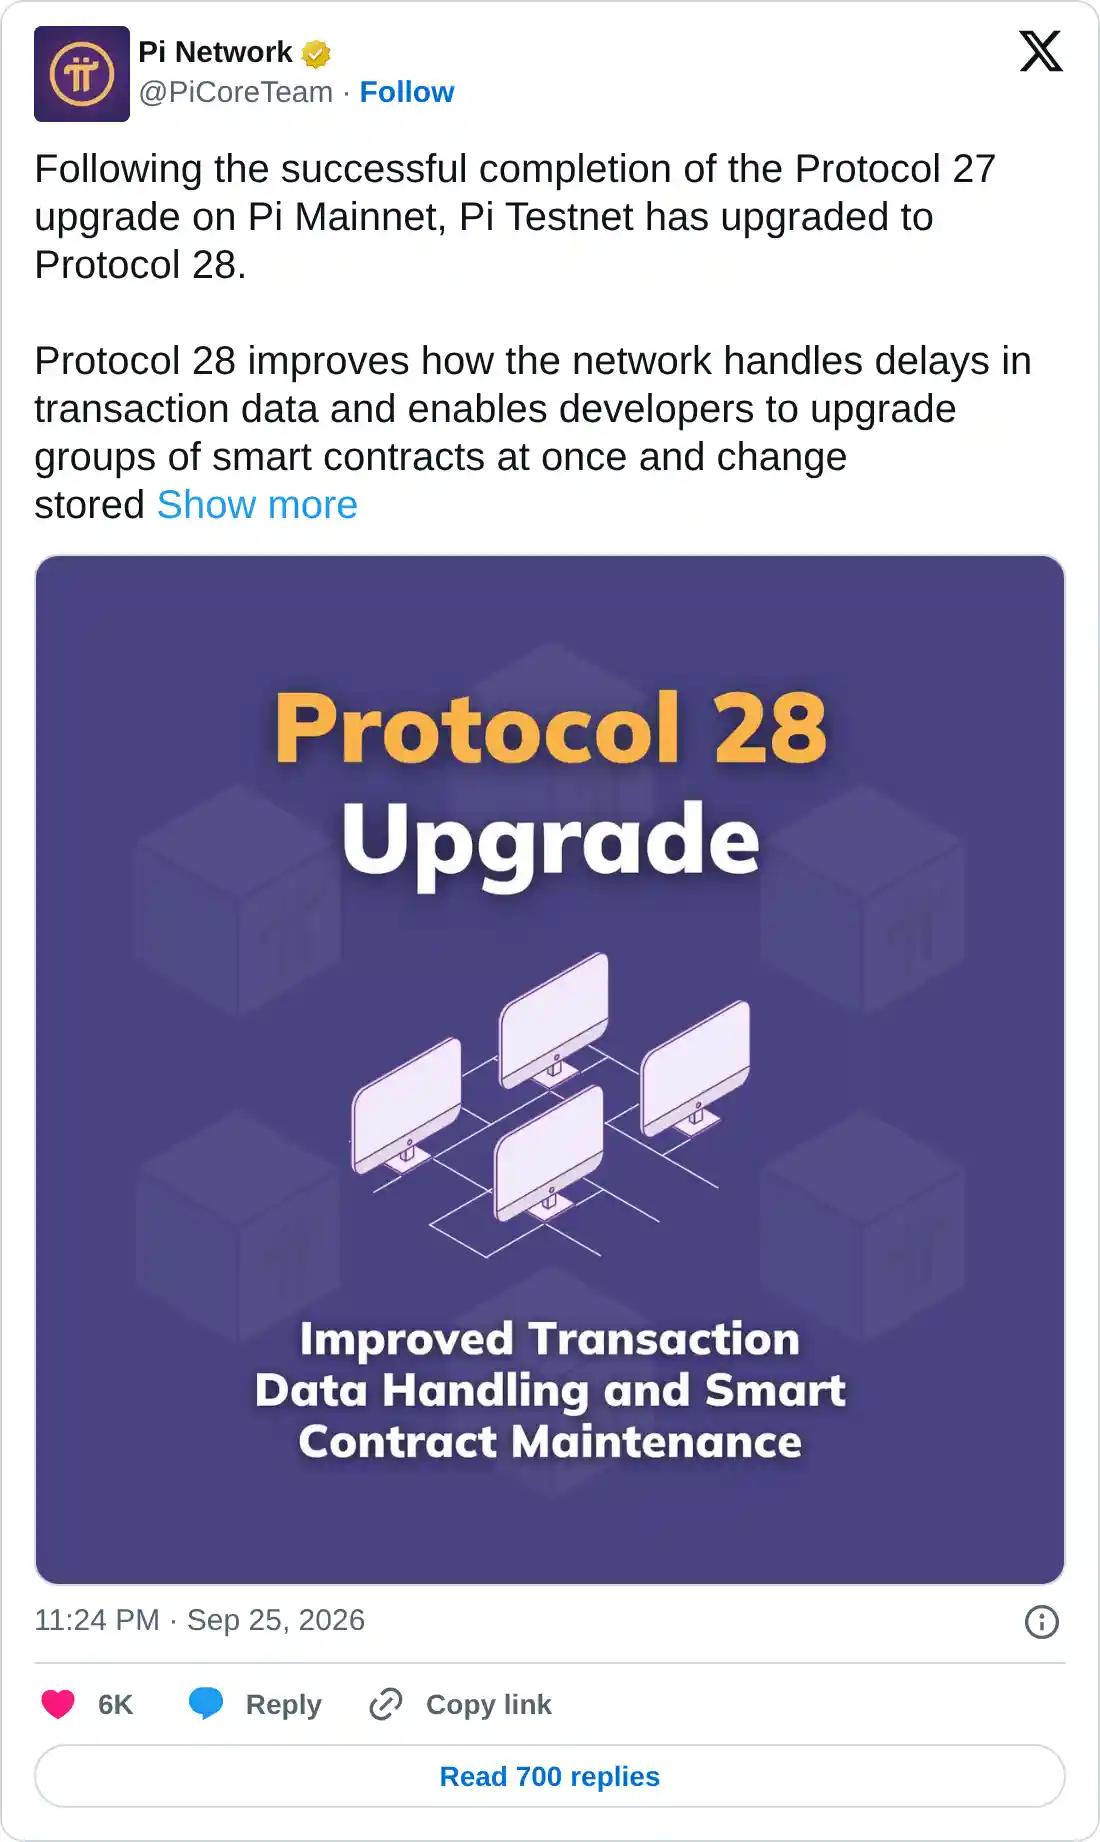
- The Pi Core Team completed Protocol 27 on Saturday and scheduled the next Protocol 28 upgrade for October 16.
- The technical outlook for the PI token is mixed, with the price remaining capped below the 50-day EMA at around $0.091.
Pi Network (PI) extends losses below $0.090 on Monday, risking the 6% gains from last week's recovery. The Pi Core Team plans to roll out the next Protocol 28 upgrade on October 16, focused on improving transaction data handling and smart contract maintenance. Pi Network must reclaim the 50-day Exponential Moving Average (EMA) at around $0.091 to extend its recovery toward the $0.1000 psychological threshold.

Pi Mainnet upgrades push for smart contract functionalities
Pi Core Team, in a social media post on Saturday, confirmed the release of Protocol 27 on the mainnet, positioning it for the next Protocol 28 upgrade. The new release brings flexible smart-contract authentication and decentralized finance (DeFi) tools. The next upgrade focuses on improving transaction data handling and smart contract maintenance. Despite the new releases and scheduled releases, Pi Network faces downside pressure, capped below the $0.1000 threshold.
Technical outlook: Pi Network risks a steeper decline as momentum eases
Pi Network edges lower on Monday, extending its pullback below the 50-day EMA at $0.0918, which capped gains last week. The 100- and 200-day EMAs at $0.1006 and $0.1241 sit well above the spot price, keeping the near-term bias bearish.
The Fibonacci retracement from $0.1341 to $0.0704 highlights the upside barrier at the 50% retracement level of $0.0990, near the 100-day EMA at $0.1006. A confirmed breakout above this resistance cluster could target the 78.6% Fibonacci retracement at $0.1204.
Momentum on the daily chart shows neutral momentum marginally shifting bearish as the Relative Strength Index (RSI), around 47, dips below the midline, while the Moving Average Convergence Divergence (MACD) holds marginally above the signal line, reaffirming the lack of strong trend conviction.
On the downside, initial support aligns with the 23.6% Fibonacci retracement at $0.0827, ahead of the July 31 low at $0.0801 and the more important structural floor near the cycle low at $0.0704.
(The technical analysis of this story was written with the help of an AI tool. Know more.)
Artículos destacados
1Canadian Dollar struggles as US-Canada yield gap widens2Ripple Price Forecast: XRP loses $1.50 as profit-taking outweighs ETF inflows3US-Iran indirect talks to resume in US as mediators revisit seven-day proposal - Reuters4Bitcoin price forecast: BTC dips as ETF inflows meet Fed headwinds5AUD/NZD Price Forecast: Aussie rally shows signs of exhaustion ahead of RBA decision6UK Chancellor Healey: We will maintain control of Britain's finances7Pi Network Price Forecast: PI stalls below 50-day EMA as Protocol 28 upgrade nears8British Pound gains as several BoE members warn of upside inflation risks9Oil: Higher prices drive yields and Dollar – MUFG
COTIZACIONES EN VIVO

TODO SOBRE TECHNICAL
Liquidity Sweep: Meaning, Examples & Trading Strategy
Market Structure in Trading: The Complete Guide (Bullish, Bearish, Sideways)
Change of Character (CHoCH): Definition, Examples & Strategy
What Is the Bullish Kicker Pattern and How to Trade It?
What Is a Dragonfly Doji Candlestick and How Do You Trade It?
What Is an Inverted Hammer Candlestick Pattern and How Do You Trade It?
What Is a Bullish Abandoned Baby Pattern and How Do You Trade It?
What Is the Three Outside Up Candlestick Pattern and How Do You Trade It?
What Is the Three Inside Up Candlestick Pattern?
¡Comience ahora!
Regístrese y acceda a los mercados globales en menos de 3 minutos

Conéctese con nosotros









Contactos
Teléfono: +61 2 8036 8388
Fax: +61 2 8036 8388
Correo electrónico: support@tmgm.com
Web: https://www.tmgm.com



La información proporcionada en este sitio web es únicamente de carácter general y no constituye asesoramiento financiero personal. Antes de actuar sobre cualquier información de este sitio web, debe considerar la idoneidad de la información en relación con sus objetivos, situación financiera y necesidades. Invertir en CFD y contratos de margen de FX conlleva riesgos significativos y no es adecuado para todos los inversores. Puede perder más que su depósito inicial. Usted no posee ni tiene ningún interés en el activo subyacente. Le recomendamos que busque asesoramiento independiente y se asegure de comprender plenamente los riesgos involucrados antes de operar. Es importante que lea y considere el documento de divulgación antes de adquirir cualquier producto listado en el sitio web. La información y los anuncios ofrecidos en este sitio web no están destinados al uso por parte de ninguna persona en ningún país o jurisdicción donde dicho uso sea contrario a las leyes y regulaciones locales. Los productos y servicios ofrecidos en este sitio web no están destinados a residentes de Estados Unidos, Malasia y Tailandia.
TMGM está autorizado y regulado en varias jurisdicciones.
Trademax Australia Limited, que opera como TMGM, está regulada por la Comisión Australiana de Valores e Inversiones (ASIC), AFSL n.º 436416, y está ubicada en Level 28, One International Tower, 100 Barangaroo Avenue, 2000 Sydney, NSW Australia.
Correo electrónico: support@tmgm.com.au
Trademax Global Limited, que opera como TMGM, está autorizada y regulada por la Comisión de Servicios Financieros de Vanuatu (VFSC), número de registro 40356, y está registrada en 1276, Kumul Highway, Port Vila, Vanuatu, República de Vanuatu.
Correo electrónico: support@tmgm.com
Trademax Global Markets (SE) Limited, que opera como TMGM, está autorizada y regulada por la Autoridad de Servicios Financieros (FSA) de Seychelles, con número de licencia SD224. La empresa está registrada en Office No 13, Providence Estate ABIS Centre, Mahe, Seychelles.
Correo electrónico: support@tmgm.com
Trademax Global Markets (International) Pty Ltd, que opera como TMGM, está autorizada y regulada por la Comisión de Servicios Financieros de Mauricio (FSC) con licencia n.º GB22201012, y está registrada en 33, Edith Cavell Street C/o IQ EQ Fund Services (Mauritius) Ltd Port Louis, 11324 Mauricio.
Correo electrónico: support@tmgm.com
Copyright © TMGM. Todos los derechos reservados