

Trading
Explora una amplia gama de mercados con precios competitivos, liquidez profunda y herramientas de trading avanzadas.
Más información 
Plataforma
Opera sin interrupciones con la potente plataforma de TMGM, diseñada para ofrecer velocidad, precisión y una experiencia de trading superior.
Más información Plataforma de trading
Herramientas de trading
Academia
Aprende los fundamentos del trading con recursos ideales para principiantes, incluidas guías, seminarios web y análisis del mercado.
Más información Academia TMGM
Noticias y análisis
Obtén actualizaciones del mercado en tiempo real y análisis de expertos para adelantarte a las oportunidades de trading
Más información Noticias y análisis
Acerca de
Descubre qué distingue a TMGM: nuestra presencia global, solidez regulatoria y compromiso con la innovación en el trading.
Más información Por qué elegir TMGM
Ripple and Stellar outlook: Momentum improves as bulls target further gains
- XRP hovers around $1.518 on Tuesday after gaining nearly 9% the previous day.
- XLM claims $0.213 after surging over 9% on Monday.
- Strengthening momentum indicators support further gains while mixed derivatives metrics could cap upside potential.
Ripple (XRP) and Stellar (XLM) stabilize on Tuesday after extending their gains by nearly 9% at the start of the week on Monday. Improving momentum indicators support XRP and XLM bullish price action and hint at further rally. Meanwhile, traders should remain cautious as mixed derivatives data could limit upside as both tokens try to sustain their recent upswing.

Mixed derivatives metrics
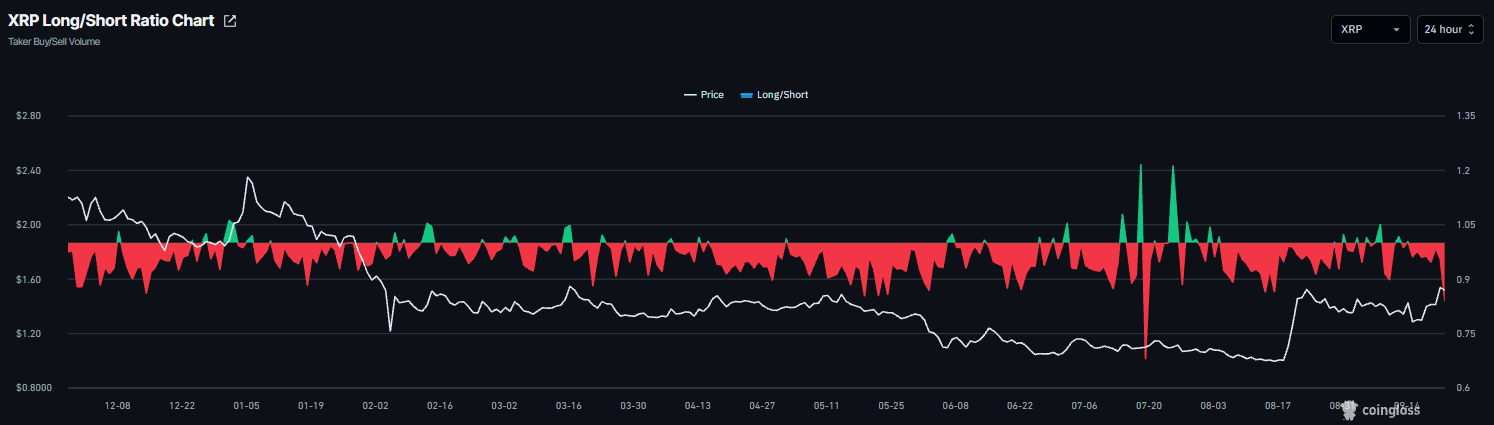
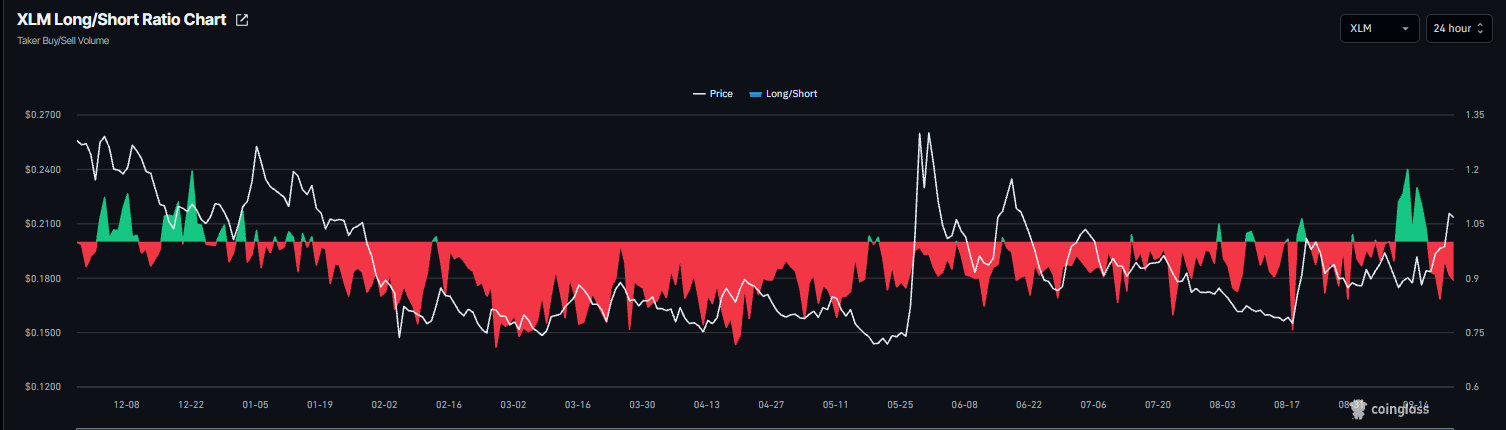
Derivatives data shows a mixed and cautious outlook among traders, despite recent gains in XRP and XLM. CoinGlass’ long-to-short ratios for Ripple and Stellar read 0.86 and 0.89, respectively, on Tuesday, nearing their lowest levels in a month. A ratio below one indicates bearish sentiment, as traders bet that asset prices will fall.
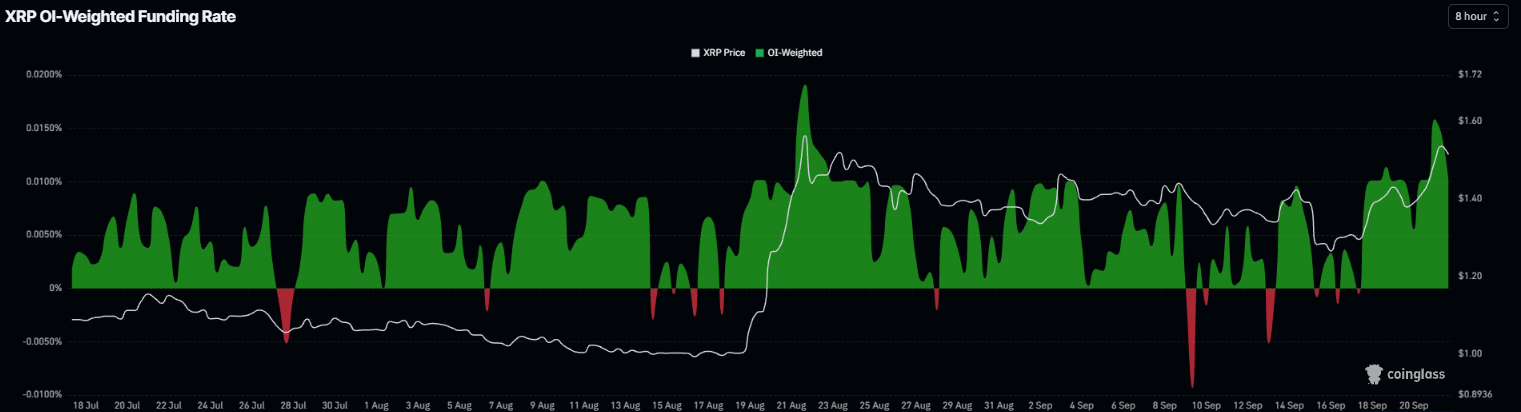
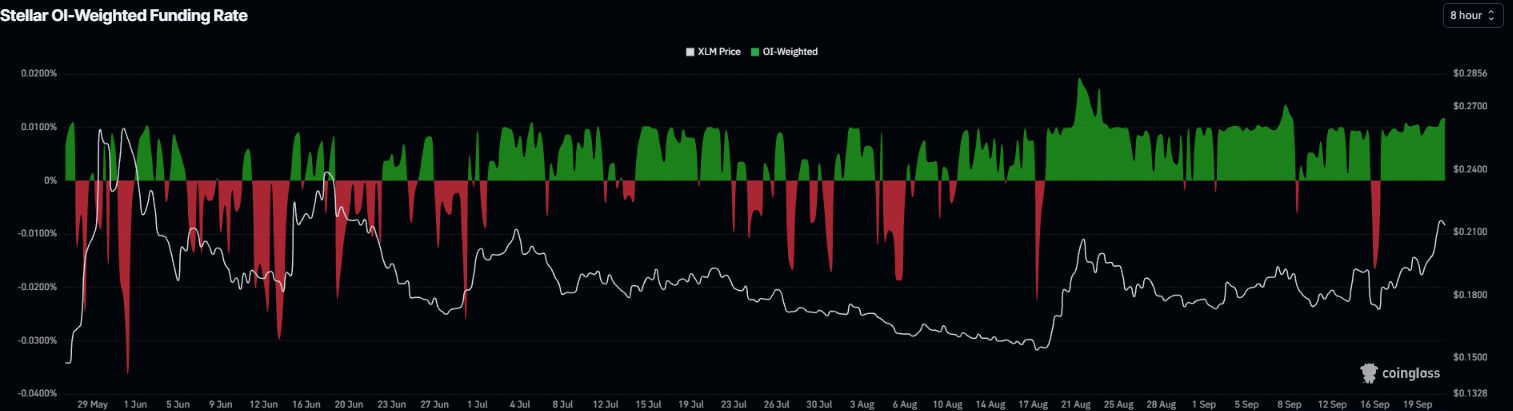
However, the funding rates for both altcoins support a bullish outlook. The XRP funding rate flipped positive on September 18 and surged to 0.010% on Tuesday. Similarly, the XLM funding rate flipped positive on September 16 and surged to 0.011% on Tuesday. These positive rates indicate longs are paying shorts, reflecting a bullish outlook for Ripple and Stellar.
XRP technical outlook: Surges after holding key level
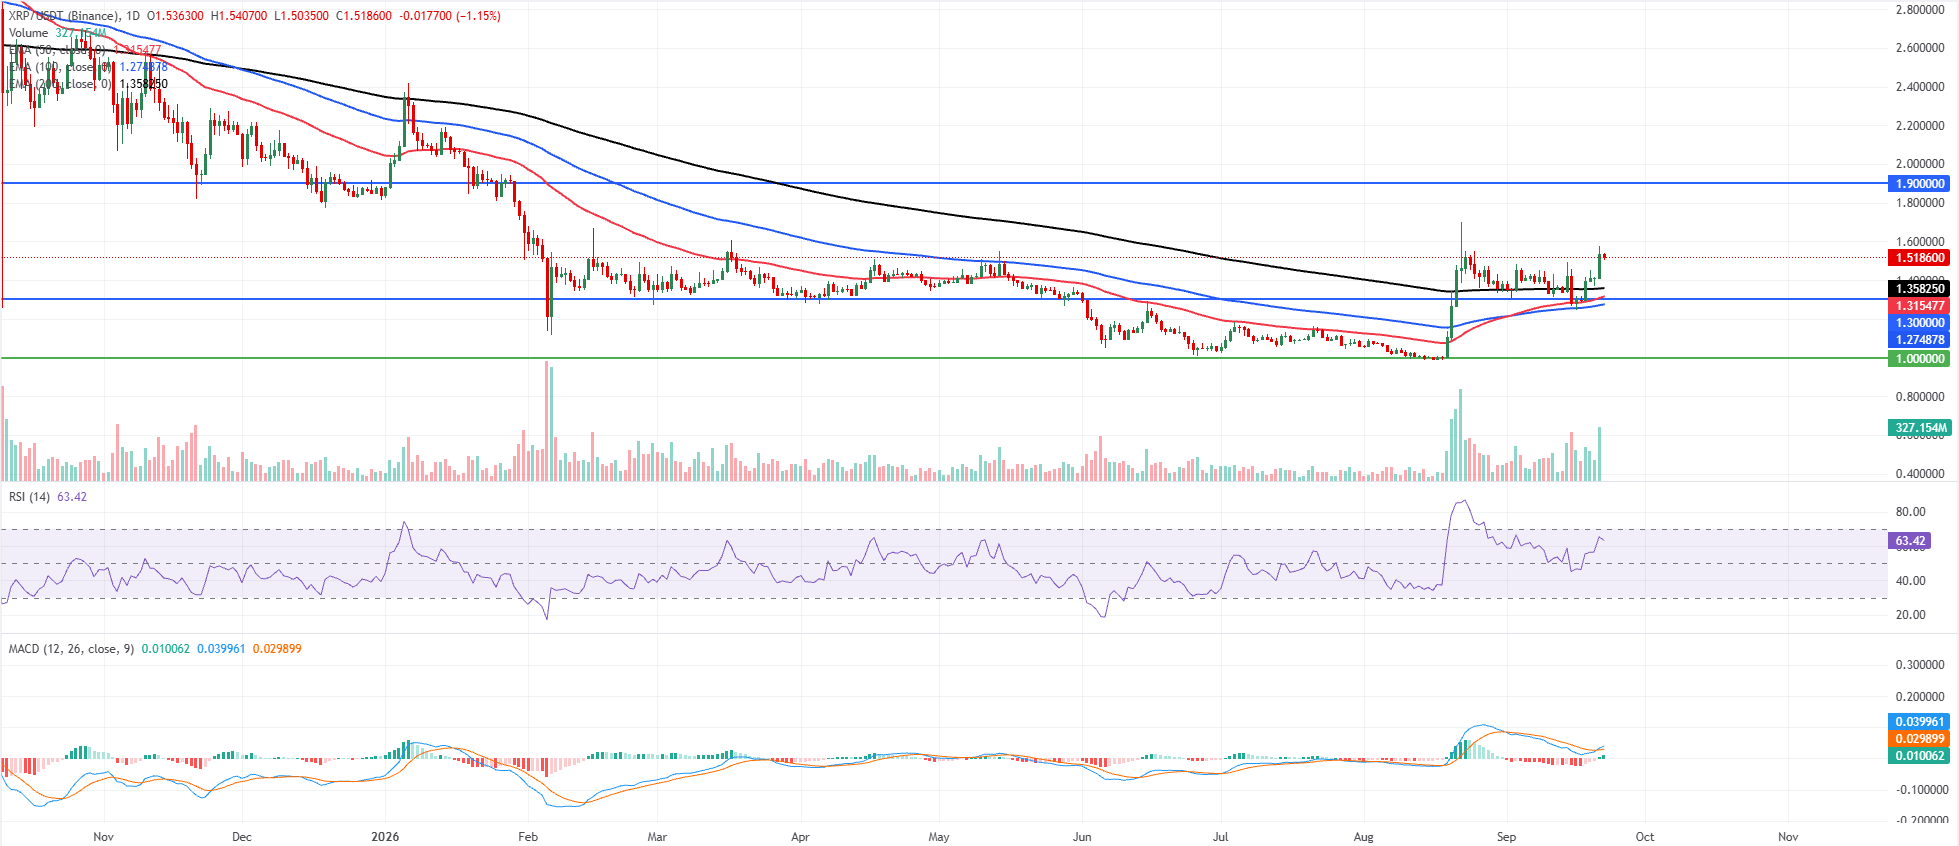
XRP price trades at $1.518 on Tuesday, extending its bullish bias as price holds well above the 50-day, 100-day, and 200-day Exponential Moving Averages (EMAs), clustered between roughly $1.274 and $1.358.
The rebound from recent lows has pushed the Relative Strength Index (RSI) to 63, indicating firm but not yet overbought momentum. At the same time, the Moving Average Convergence Divergence (MACD) has turned positive, hinting that buyers are regaining control after a period of consolidation.
On the downside, immediate support is at the 200-day EMA at $1.358, and the 50-day EMA at $1.315, with horizontal support at $1.300 reinforcing this zone; a deeper pullback could test the 100-day EMA at $1.274 before the major structural floor at $1.000.
On the topside, the next notable resistance aligns with the horizontal barrier at $1.900, where a sustained break would open the way for further gains in the broader uptrend.
XLM technical outlook: Strengthening momentum indicators
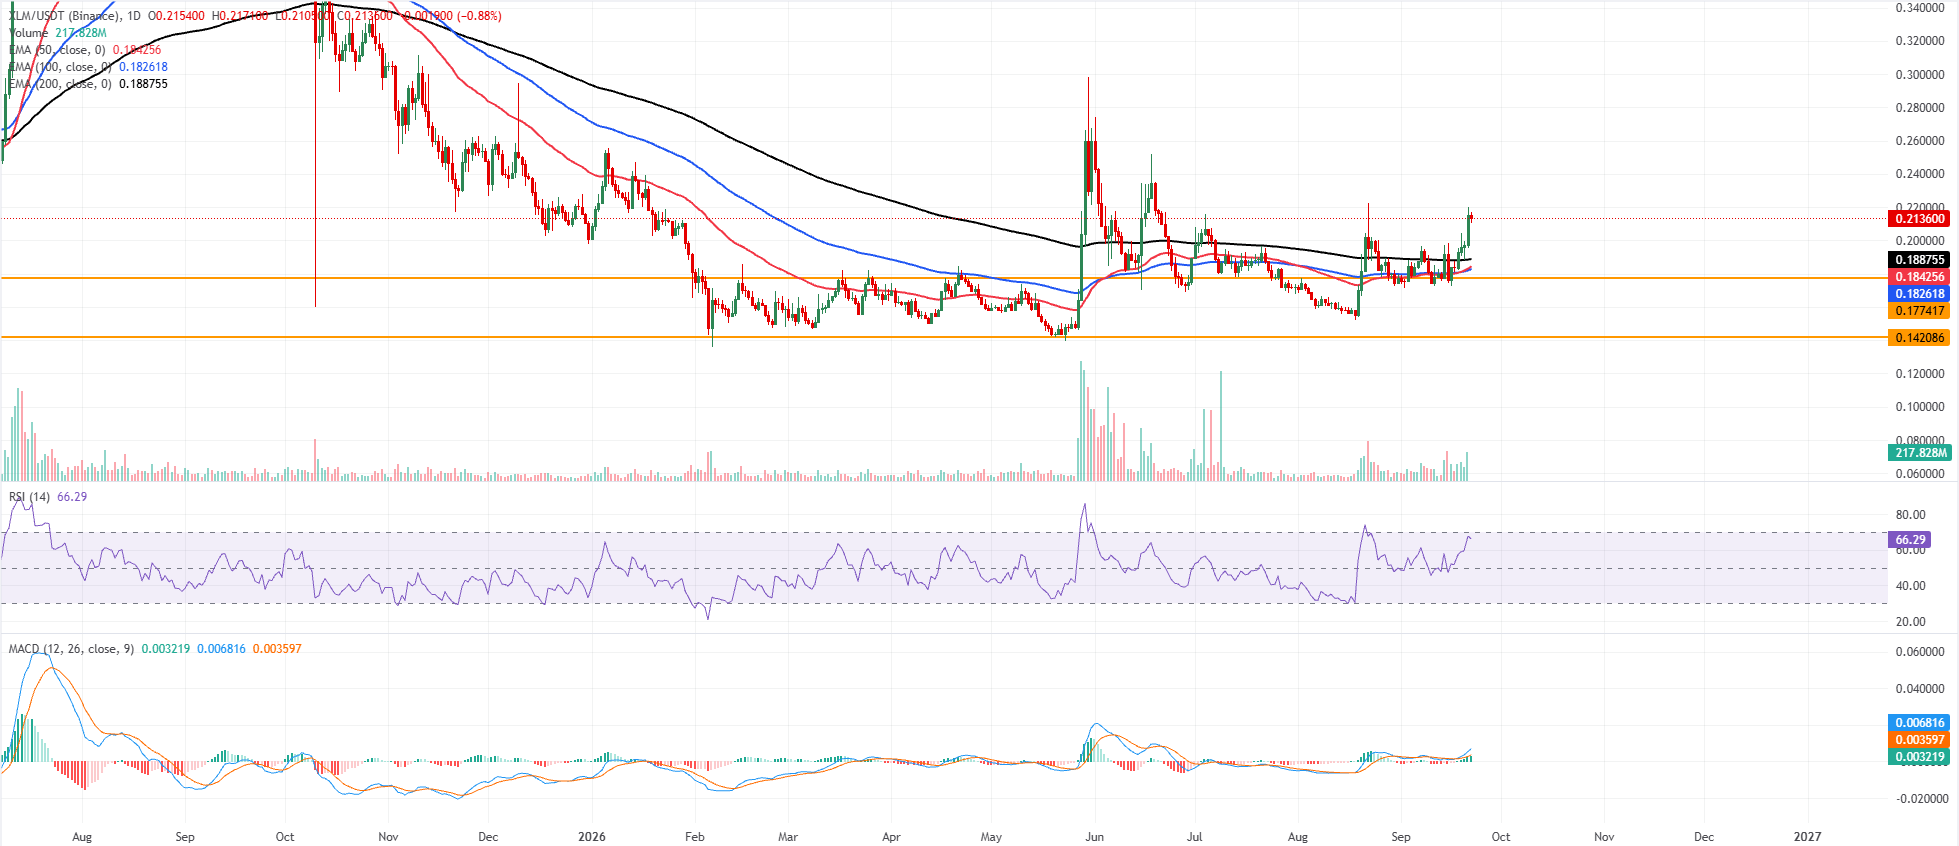
XLM price trades at $0.2135 on Tuesday after gaining over 9% the previous day. XLM maintains a clear bullish bias as price holds above the 50-day, 100-day, and 200-day EMAs, clustered between roughly $0.182 and $0.188.
The rising RSI near 66 and a positive MACD histogram both suggest strong upward momentum, reinforcing the view that the recent breakout is supported by underlying demand rather than a mere spike.
On the downside, initial support appears at the 200-day EMA near $0.188, followed by the short-term 50-day EMA around $0.184 and the 100-day EMA at $0.182, which together create a dense demand zone before the horizontal base at $0.177. A deeper pullback would expose the more distant structural floor near $0.142, but as long as XLM holds above the EMA cluster, buyers are likely to defend dips, keeping the path of least resistance pointed higher.
(The technical analysis of this story was written with the help of an AI tool. Know more.)
Artículos destacados
1Pepe Price Forecast: PEPE signals trend reversal amid a short squeeze2India Gold price today: Gold falls, according to FXStreet data3AUD/JPY Price Forecast: Sticks to gains above 112.00 as bulls await 50% Fibo. breakout4Swiss Franc gains as US Dollar declines on increased risk appetite5Gold struggles to lure buyers amid hawkish Fed counters sliding US bond yields6Crypto Overview: Bitcoin tops $85,000 post-CLARITY Act failure – TAO and FET lead gains7Ripple and Stellar outlook: Momentum improves as bulls target further gains8RBA’s Bullock: Supply shocks are difficult for monetary policy to deal with9US Dollar Index Price Forecast: Needs a decisive move above 100.56 for fresh upside leg
COTIZACIONES EN VIVO

TODO SOBRE TECHNICAL
What Is the Dark Cloud Cover Pattern and How Do You Trade It?
What Is the Piercing Line Candlestick Pattern and How Do You Trade It?
What Are Tweezer Top and Bottom Candlestick Patterns?
Inside Bar Candlestick Pattern: What It Is, How to Identify It, and How to Trade It
Hanging Man Candlestick Pattern: How to Identify and Trade It
VWMA vs VWAP: Key Differences, Formulas and Which to Use
What Is Volume-Weighted Average Price (VWAP)? Formula, Settings and Strategies
Volume Weighted Moving Average (VWMA): Formula, Signals, and Strategy
Double Exponential Moving Average: How It Works & How to Use It
¡Comience ahora!
Regístrese y acceda a los mercados globales en menos de 3 minutos

Conéctese con nosotros









Contactos
Teléfono: +61 2 8036 8388
Fax: +61 2 8036 8388
Correo electrónico: support@tmgm.com
Web: https://www.tmgm.com



La información proporcionada en este sitio web es únicamente de carácter general y no constituye asesoramiento financiero personal. Antes de actuar sobre cualquier información de este sitio web, debe considerar la idoneidad de la información en relación con sus objetivos, situación financiera y necesidades. Invertir en CFD y contratos de margen de FX conlleva riesgos significativos y no es adecuado para todos los inversores. Puede perder más que su depósito inicial. Usted no posee ni tiene ningún interés en el activo subyacente. Le recomendamos que busque asesoramiento independiente y se asegure de comprender plenamente los riesgos involucrados antes de operar. Es importante que lea y considere el documento de divulgación antes de adquirir cualquier producto listado en el sitio web. La información y los anuncios ofrecidos en este sitio web no están destinados al uso por parte de ninguna persona en ningún país o jurisdicción donde dicho uso sea contrario a las leyes y regulaciones locales. Los productos y servicios ofrecidos en este sitio web no están destinados a residentes de Estados Unidos, Malasia y Tailandia.
TMGM está autorizado y regulado en varias jurisdicciones.
Trademax Australia Limited, que opera como TMGM, está regulada por la Comisión Australiana de Valores e Inversiones (ASIC), AFSL n.º 436416, y está ubicada en Level 28, One International Tower, 100 Barangaroo Avenue, 2000 Sydney, NSW Australia.
Correo electrónico: support@tmgm.com.au
Trademax Global Limited, que opera como TMGM, está autorizada y regulada por la Comisión de Servicios Financieros de Vanuatu (VFSC), número de registro 40356, y está registrada en 1276, Kumul Highway, Port Vila, Vanuatu, República de Vanuatu.
Correo electrónico: support@tmgm.com
Trademax Global Markets (SE) Limited, que opera como TMGM, está autorizada y regulada por la Autoridad de Servicios Financieros (FSA) de Seychelles, con número de licencia SD224. La empresa está registrada en Office No 13, Providence Estate ABIS Centre, Mahe, Seychelles.
Correo electrónico: support@tmgm.com
Trademax Global Markets (International) Pty Ltd, que opera como TMGM, está autorizada y regulada por la Comisión de Servicios Financieros de Mauricio (FSC) con licencia n.º GB22201012, y está registrada en 33, Edith Cavell Street C/o IQ EQ Fund Services (Mauritius) Ltd Port Louis, 11324 Mauricio.
Correo electrónico: support@tmgm.com
Copyright © TMGM. Todos los derechos reservados