

Trading
Explora una amplia gama de mercados con precios competitivos, liquidez profunda y herramientas de trading avanzadas.
Más información 
Plataforma
Opera sin interrupciones con la potente plataforma de TMGM, diseñada para ofrecer velocidad, precisión y una experiencia de trading superior.
Más información Plataforma de trading
Herramientas de trading
Academia
Aprende los fundamentos del trading con recursos ideales para principiantes, incluidas guías, seminarios web y análisis del mercado.
Más información Academia TMGM
Noticias y análisis
Obtén actualizaciones del mercado en tiempo real y análisis de expertos para adelantarte a las oportunidades de trading
Más información Noticias y análisis
Acerca de
Descubre qué distingue a TMGM: nuestra presencia global, solidez regulatoria y compromiso con la innovación en el trading.
Más información Por qué elegir TMGM
Silver Price Forecast: Bears crowd $60 after six-percent weekly rout
- XAG/USD ends week down over 6%, approaching $60.00 support.
- Bearish RSI reinforces lower-high, lower-low structure beneath key moving averages.
- Break below $60.00 exposes $56.57 and YTD low $54.77.
Silver price retreats on Friday, dropping about 0.76% as US Treasury yields edged higher, capping US Dollar depreciation, while investors punished the Greenback following a soft US jobs report. The XAG/USD trades at $60.50 at the time of writing.
XAG/USD Price Forecast: Technical Outlook
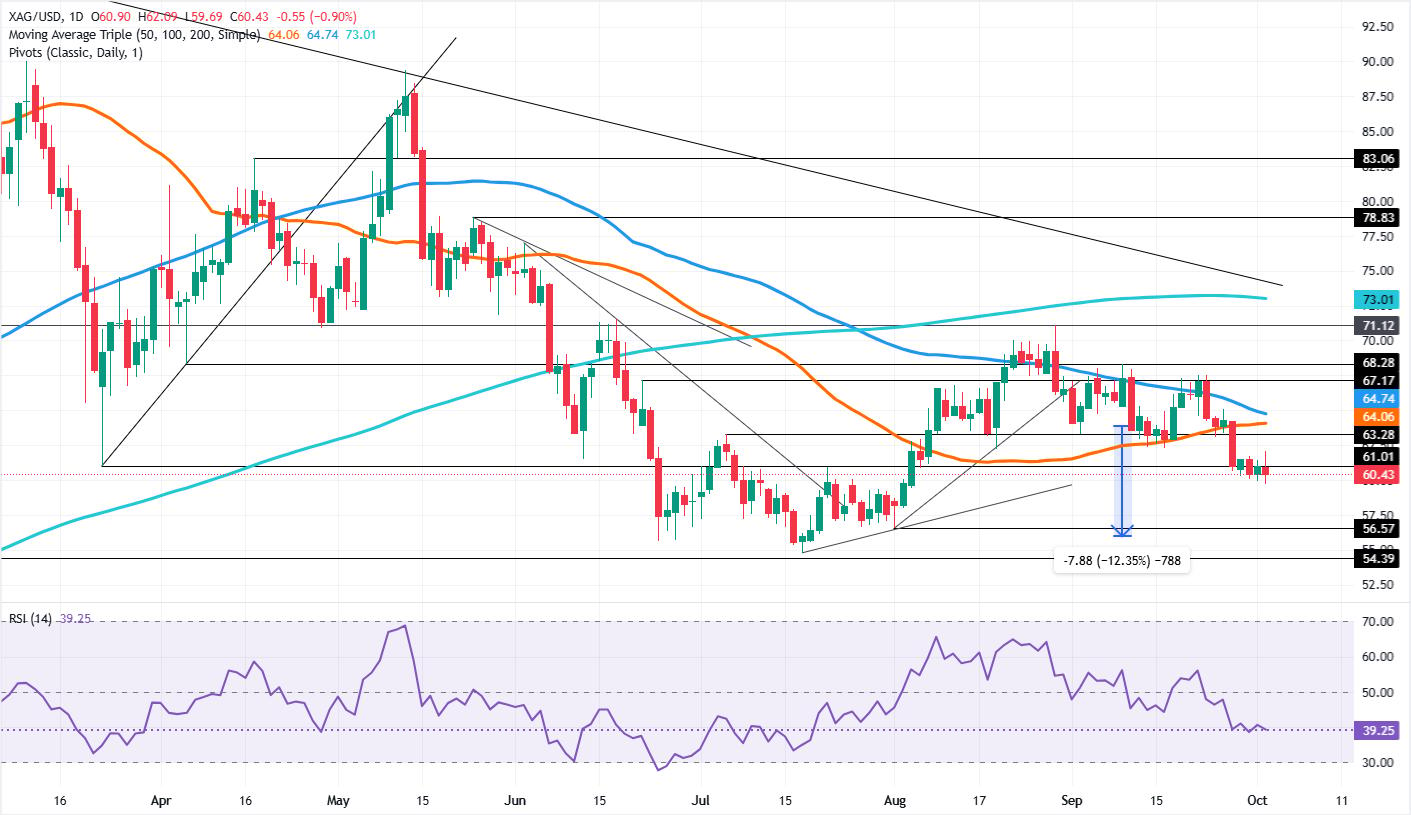
The white metal finished with weekly losses of over 6%, below the confluence of the 50- and 100-day Simple Moving Averages (SMAs) at $64.06-$64.74 and poised to test the $60.00 milestone in the near term.

Bearish momentum continues to build as the Relative Strength Index (RSI) remains below its 50-neutral level and closer to the oversold level. Also, price action is respecting the series of lower highs and lower lows, further confirmation that sellers are in charge.
The first support for XAG/USD is $60.00. If breached, a potential move to the August 3 low of the day (LOD) at $56.57 is on the cards. A decisive breakout will expose the year-to-date (YTD) low of $54.77.
On the other hand, for a bullish reversal, buyers must push Silver back above the 50- and 100-day SMA, before claiming the $65.00. Even though that is a significant recovery, the bearish structure remains in charge, unless the bull clears the August 28 swing high of $71.12, the latest cycle high.
XAG/USD Price Chart – Daily
Silver FAQs
Silver is a precious metal highly traded among investors. It has been historically used as a store of value and a medium of exchange. Although less popular than Gold, traders may turn to Silver to diversify their investment portfolio, for its intrinsic value or as a potential hedge during high-inflation periods. Investors can buy physical Silver, in coins or in bars, or trade it through vehicles such as Exchange Traded Funds, which track its price on international markets.
Silver prices can move due to a wide range of factors. Geopolitical instability or fears of a deep recession can make Silver price escalate due to its safe-haven status, although to a lesser extent than Gold's. As a yieldless asset, Silver tends to rise with lower interest rates. Its moves also depend on how the US Dollar (USD) behaves as the asset is priced in dollars (XAG/USD). A strong Dollar tends to keep the price of Silver at bay, whereas a weaker Dollar is likely to propel prices up. Other factors such as investment demand, mining supply – Silver is much more abundant than Gold – and recycling rates can also affect prices.
Silver is widely used in industry, particularly in sectors such as electronics or solar energy, as it has one of the highest electric conductivity of all metals – more than Copper and Gold. A surge in demand can increase prices, while a decline tends to lower them. Dynamics in the US, Chinese and Indian economies can also contribute to price swings: for the US and particularly China, their big industrial sectors use Silver in various processes; in India, consumers’ demand for the precious metal for jewellery also plays a key role in setting prices.
Silver prices tend to follow Gold's moves. When Gold prices rise, Silver typically follows suit, as their status as safe-haven assets is similar. The Gold/Silver ratio, which shows the number of ounces of Silver needed to equal the value of one ounce of Gold, may help to determine the relative valuation between both metals. Some investors may consider a high ratio as an indicator that Silver is undervalued, or Gold is overvalued. On the contrary, a low ratio might suggest that Gold is undervalued relative to Silver.
Artículos destacados
1Silver Price Forecast: Bears crowd $60 after six-percent weekly rout2Ethereum Price Forecast: ETH erases gains as market discounts weak jobs report3Mexican Peso rebounds, but carry trade exodus still bites4United States CFTC Oil NC Net Positions: 109.5K vs previous 141.1K5United States CFTC Gold NC Net Positions dipped from previous $225.9K to $218.6K6Japan CFTC JPY NC Net Positions dipped from previous ¥72K to ¥55.4K7United States CFTC S&P 500 NC Net Positions fell from previous $-133.2K to $-142.5K8United Kingdom CFTC GBP NC Net Positions declined to £-91.1K from previous £-82.6K9Australia CFTC AUD NC Net Positions down to $-63.2K from previous $-46.8K
COTIZACIONES EN VIVO


TODO SOBRE GOLD & PRECIOUS METALS
6 Best Indicators for Gold Trading
Short-Term Gold Trading: How It Works, Strategies, How to Start
Gold Trading Leverage: How It Works, Pros and Cons, Risk Management
Gold Trading Signals: How They Work, Why Use Them, Where to Find
How to Trade Gold (XAUUSD) in Forex
Gold (XAUUSD) Trading Hours: Best Time to Trade Gold
How to Trade Gold
Why Invest in Gold CFD? A Beginner’s Guide to Smart Investing
7 Ways to Invest in Gold
¡Comience ahora!
Regístrese y acceda a los mercados globales en menos de 3 minutos

Conéctese con nosotros









Contactos
Teléfono: +61 2 8036 8388
Fax: +61 2 8036 8388
Correo electrónico: support@tmgm.com
Web: https://www.tmgm.com



La información proporcionada en este sitio web es únicamente de carácter general y no constituye asesoramiento financiero personal. Antes de actuar sobre cualquier información de este sitio web, debe considerar la idoneidad de la información en relación con sus objetivos, situación financiera y necesidades. Invertir en CFD y contratos de margen de FX conlleva riesgos significativos y no es adecuado para todos los inversores. Puede perder más que su depósito inicial. Usted no posee ni tiene ningún interés en el activo subyacente. Le recomendamos que busque asesoramiento independiente y se asegure de comprender plenamente los riesgos involucrados antes de operar. Es importante que lea y considere el documento de divulgación antes de adquirir cualquier producto listado en el sitio web. La información y los anuncios ofrecidos en este sitio web no están destinados al uso por parte de ninguna persona en ningún país o jurisdicción donde dicho uso sea contrario a las leyes y regulaciones locales. Los productos y servicios ofrecidos en este sitio web no están destinados a residentes de Estados Unidos, Malasia y Tailandia.
TMGM está autorizado y regulado en varias jurisdicciones.
Trademax Australia Limited, que opera como TMGM, está regulada por la Comisión Australiana de Valores e Inversiones (ASIC), AFSL n.º 436416, y está ubicada en Level 28, One International Tower, 100 Barangaroo Avenue, 2000 Sydney, NSW Australia.
Correo electrónico: support@tmgm.com.au
Trademax Global Limited, que opera como TMGM, está autorizada y regulada por la Comisión de Servicios Financieros de Vanuatu (VFSC), número de registro 40356, y está registrada en 1276, Kumul Highway, Port Vila, Vanuatu, República de Vanuatu.
Correo electrónico: support@tmgm.com
Trademax Global Markets (SE) Limited, que opera como TMGM, está autorizada y regulada por la Autoridad de Servicios Financieros (FSA) de Seychelles, con número de licencia SD224. La empresa está registrada en Office No 13, Providence Estate ABIS Centre, Mahe, Seychelles.
Correo electrónico: support@tmgm.com
Trademax Global Markets (International) Pty Ltd, que opera como TMGM, está autorizada y regulada por la Comisión de Servicios Financieros de Mauricio (FSC) con licencia n.º GB22201012, y está registrada en 33, Edith Cavell Street C/o IQ EQ Fund Services (Mauritius) Ltd Port Louis, 11324 Mauricio.
Correo electrónico: support@tmgm.com
Copyright © TMGM. Todos los derechos reservados