

Trading
Explora una amplia gama de mercados con precios competitivos, liquidez profunda y herramientas de trading avanzadas.
Más información 
Plataforma
Opera sin interrupciones con la potente plataforma de TMGM, diseñada para ofrecer velocidad, precisión y una experiencia de trading superior.
Más información Plataforma de trading
Herramientas de trading
Academia
Aprende los fundamentos del trading con recursos ideales para principiantes, incluidas guías, seminarios web y análisis del mercado.
Más información Academia TMGM
Noticias y análisis
Obtén actualizaciones del mercado en tiempo real y análisis de expertos para adelantarte a las oportunidades de trading
Más información Noticias y análisis
Acerca de
Descubre qué distingue a TMGM: nuestra presencia global, solidez regulatoria y compromiso con la innovación en el trading.
Más información Por qué elegir TMGM
Solana Price Forecast: Bulls hold control as ETF inflows strengthen and RWAs, stablecoin metrics hit records
- Solana edges lower and trades below $119 on Monday after gaining more than 22% over the past two weeks.
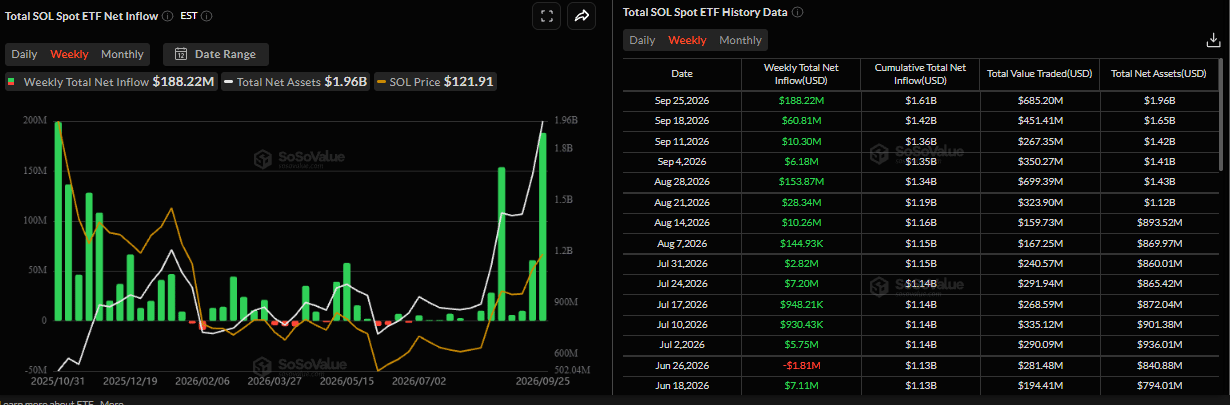
- US-listed spot ETFs recorded an inflow of $188.22 million last week, the second-highest weekly inflow since their launch.
- Stablecoin supply on SOL hit a new record high of $17.3 billion, while its RWA ecosystem also hit a new all-time high of over $4.6 billion.
Solana (SOL) faces a mild pullback, trading below $119 on Monday after gaining over 22% in the last two weeks. Despite this correction, SOL bulls remain in control, with institutional demand recording the second-highest weekly inflow through spot Exchange Traded Funds (ETFs).

In addition, record levels in stablecoin supply and the real-world asset (RWA) ecosystem suggest strengthening fundamentals, further supporting a bullish outlook for SOL.
Second-highest weekly inflow
SoSovalue data show that SOL spot ETFs recorded a weekly inflow of $188.22 million last week, marking the second-highest weekly inflow since their launch. Moreover, last week's inflow also marked the 13th consecutive week of positive flows since early June, highlighting robust institutional demand. If these inflows continue and intensify through the week, SOL could extend its ongoing rally.
RWAs, stablecoin metrics hit records
Solana's official X account posted on Monday that its ecosystem growth reached record levels.
Stablecoin supply on SOL hit a new all-time high (ATH) of $17.3 billion. In addition, its RWA ecosystem hit a new ATH of over $4.6 billion across 3,000+ available assets, with tokenized equity holders on Solana crossing 1 million.
These milestones suggest the ecosystem is strengthening, supporting a further bullish outlook for SOL.
Solana technical outlook: Faces mild pullback
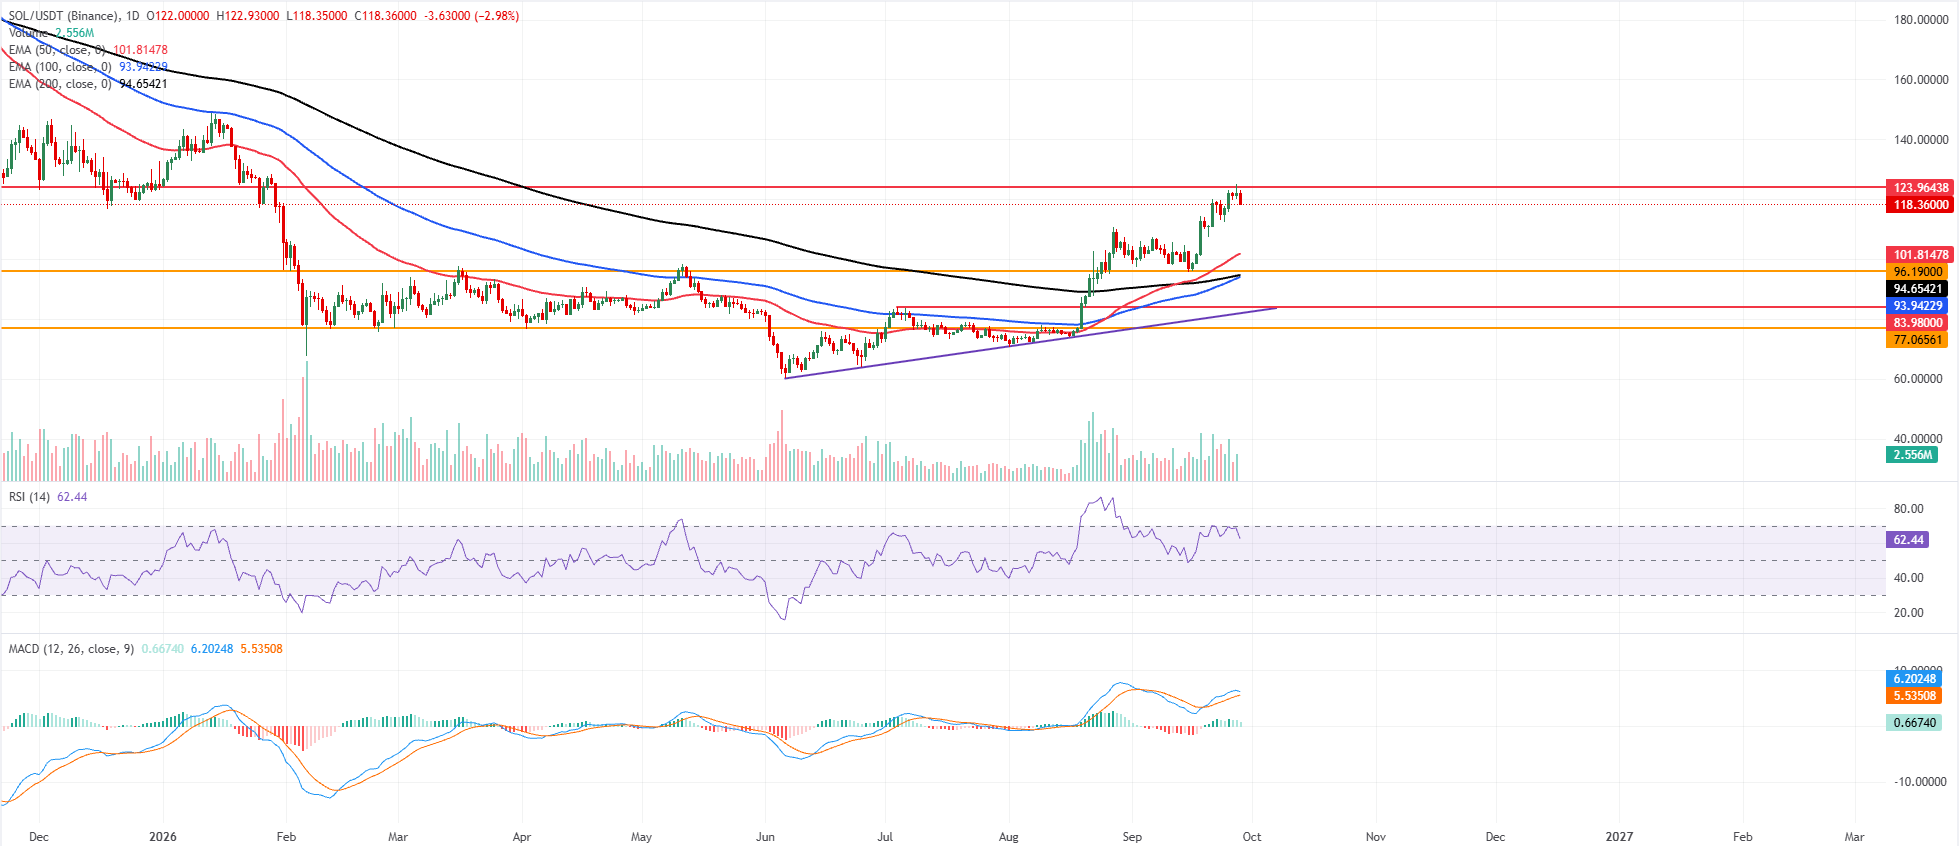
Solana price trades at $118.36 at the time of writing on Monday, holding a bullish near-term bias as it remains comfortably above the 50-day Exponential Moving Average (EMA) at $101.81 and the longer-term 100-day and 200-day EMAs at $93.94 and $94.65, respectively.
The upward-sloping trendline support originating near $81.96 continues to underpin the broader advance. At the same time, the Relative Strength Index (RSI) around 62 on the daily chart suggests constructive but not overbought momentum, reinforced by a positive Moving Average Convergence Divergence (MACD) histogram reading.
On the downside, immediate support emerges at the 50-day EMA near $101.81, followed by the horizontal floor at $96.19 and the clustered longer-term EMAs in the $93–$95 area, ahead of the trendline and horizontal supports at $81.96 and $77.07.
On the topside, initial resistance is seen at the horizontal barrier around $123.96. A daily close above this cap would open the way for a continuation of the prevailing uptrend toward higher levels.
(The technical analysis of this story was written with the help of an AI tool. Know more.)
Artículos destacados
1EUR/USD: Inflation-driven stabilisation hopes – ING2EUR/GBP Price Forecast: Fails at 0.8610 amid higher Oil prices, BoE hawkishness3Australian Dollar: Hawkish RBA hike expectations – ING4USD/CAD Price Forecast: Holds gains above 1.4150, while technicals flag overbought risk5Indonesian Rupiah: Rate support erodes as outflows resume – MUFG6Forex Today: Gold slumps below $4,200 on hawkish Fed outlook, Mideast tensions7Silver Price Forecast: XAG/USD falls like house of cards on Fed’s hawkish narrative8Euro: Rate uncertainty and energy costs weigh – HSBC9Japanese Yen nudges lower despite a hawkish BoJ, intervention warnings
COTIZACIONES EN VIVO


TODO SOBRE TECHNICAL
Market Structure in Trading: The Complete Guide (Bullish, Bearish, Sideways)
Change of Character (CHoCH): Definition, Examples & Strategy
What Is the Bullish Kicker Pattern and How to Trade It?
What Is a Dragonfly Doji Candlestick and How Do You Trade It?
What Is an Inverted Hammer Candlestick Pattern and How Do You Trade It?
What Is a Bullish Abandoned Baby Pattern and How Do You Trade It?
What Is the Three Outside Up Candlestick Pattern and How Do You Trade It?
What Is the Three Inside Up Candlestick Pattern?
What Is the Dark Cloud Cover Pattern and How Do You Trade It?
¡Comience ahora!
Regístrese y acceda a los mercados globales en menos de 3 minutos

Conéctese con nosotros









Contactos
Teléfono: +61 2 8036 8388
Fax: +61 2 8036 8388
Correo electrónico: support@tmgm.com
Web: https://www.tmgm.com



La información proporcionada en este sitio web es únicamente de carácter general y no constituye asesoramiento financiero personal. Antes de actuar sobre cualquier información de este sitio web, debe considerar la idoneidad de la información en relación con sus objetivos, situación financiera y necesidades. Invertir en CFD y contratos de margen de FX conlleva riesgos significativos y no es adecuado para todos los inversores. Puede perder más que su depósito inicial. Usted no posee ni tiene ningún interés en el activo subyacente. Le recomendamos que busque asesoramiento independiente y se asegure de comprender plenamente los riesgos involucrados antes de operar. Es importante que lea y considere el documento de divulgación antes de adquirir cualquier producto listado en el sitio web. La información y los anuncios ofrecidos en este sitio web no están destinados al uso por parte de ninguna persona en ningún país o jurisdicción donde dicho uso sea contrario a las leyes y regulaciones locales. Los productos y servicios ofrecidos en este sitio web no están destinados a residentes de Estados Unidos, Malasia y Tailandia.
TMGM está autorizado y regulado en varias jurisdicciones.
Trademax Australia Limited, que opera como TMGM, está regulada por la Comisión Australiana de Valores e Inversiones (ASIC), AFSL n.º 436416, y está ubicada en Level 28, One International Tower, 100 Barangaroo Avenue, 2000 Sydney, NSW Australia.
Correo electrónico: support@tmgm.com.au
Trademax Global Limited, que opera como TMGM, está autorizada y regulada por la Comisión de Servicios Financieros de Vanuatu (VFSC), número de registro 40356, y está registrada en 1276, Kumul Highway, Port Vila, Vanuatu, República de Vanuatu.
Correo electrónico: support@tmgm.com
Trademax Global Markets (SE) Limited, que opera como TMGM, está autorizada y regulada por la Autoridad de Servicios Financieros (FSA) de Seychelles, con número de licencia SD224. La empresa está registrada en Office No 13, Providence Estate ABIS Centre, Mahe, Seychelles.
Correo electrónico: support@tmgm.com
Trademax Global Markets (International) Pty Ltd, que opera como TMGM, está autorizada y regulada por la Comisión de Servicios Financieros de Mauricio (FSC) con licencia n.º GB22201012, y está registrada en 33, Edith Cavell Street C/o IQ EQ Fund Services (Mauritius) Ltd Port Louis, 11324 Mauricio.
Correo electrónico: support@tmgm.com
Copyright © TMGM. Todos los derechos reservados