

USD/CHF Price Forecast: Shooting star warns bulls below 0.8200
- USD/CHF extends seven-day rally, but 0.8200 caps upside.
- Bullish RSI supports trend, though shooting star warns correction.
- Break below 0.8124 exposes 50-day SMA and 0.8052.
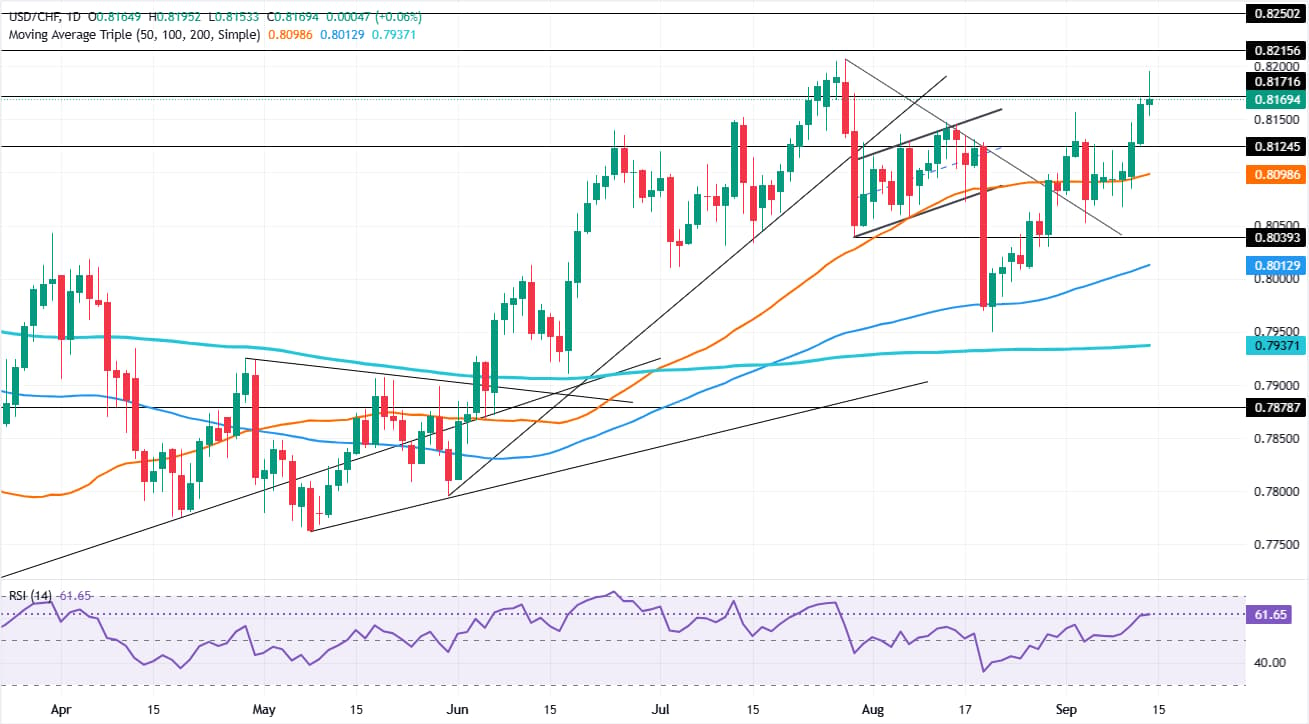
The USD/CHF extends its gains for the seventh straight trading session, up a minimal 0.05% after registering a one-month high of 0.8195, shy of cracking the 0.8200, but ultimately the pair is poised to end the session at around 0.8169.
USD/CHF Price Forecast: Technical Outlook
The overall trend is up, but a looming shooting star could trigger a short-term pullback in the USD/CHF. The Relative Strength Index (RSI) indicates bullish momentum, trending higher. So even though the market structure could point lower, it could be a short-lived leg down, before the uptrend resumes.

If bullish momentum resumes, the USD/CHF may re-test the 0.8200 figure. A decisive breakout can drive spot prices past the yearly high of 0.8207, with the June 19 2025, seen as the next resistance area at 0.8215, ahead of the June 4, 2025, high at 0.8250. On further strength up next is 0.8300.
For a bearish reversal, the USD/CHF needs to drop below the September 11 swing low of 0.8124, followed by the 50-day SMA at 0.8098. Once cleared, the next area of interest becomes the September 3 low of 0.8052.
USD/CHF Chart – Daily
Swiss Franc Price Today
The table below shows the percentage change of Swiss Franc (CHF) against listed major currencies today. Swiss Franc was the strongest against the New Zealand Dollar.
| USD | EUR | GBP | JPY | CAD | AUD | NZD | CHF | |
|---|---|---|---|---|---|---|---|---|
| USD | 0.43% | 0.18% | 0.56% | 0.23% | 0.44% | 0.62% | 0.17% | |
| EUR | -0.43% | -0.22% | 0.07% | -0.23% | 0.00% | 0.20% | -0.26% | |
| GBP | -0.18% | 0.22% | 0.31% | 0.02% | 0.23% | 0.42% | -0.10% | |
| JPY | -0.56% | -0.07% | -0.31% | -0.32% | -0.09% | 0.08% | -0.41% | |
| CAD | -0.23% | 0.23% | -0.02% | 0.32% | 0.20% | 0.38% | -0.11% | |
| AUD | -0.44% | -0.00% | -0.23% | 0.09% | -0.20% | 0.19% | -0.34% | |
| NZD | -0.62% | -0.20% | -0.42% | -0.08% | -0.38% | -0.19% | -0.53% | |
| CHF | -0.17% | 0.26% | 0.10% | 0.41% | 0.11% | 0.34% | 0.53% |
The heat map shows percentage changes of major currencies against each other. The base currency is picked from the left column, while the quote currency is picked from the top row. For example, if you pick the Swiss Franc from the left column and move along the horizontal line to the US Dollar, the percentage change displayed in the box will represent CHF (base)/USD (quote).














