
Key Takeaways
Start wide, finish narrow. Top down analysis in trading begins with the big picture on higher time frames, then zooms into lower charts to plan precise entries and exits.
Follow a clear workflow. Review global growth, inflation, interest rates and geopolitics, then country data and central bank policy, then daily or weekly charts, and finally one hour or lower charts for triggers, support, resistance and stop loss placement.
Use tools for confirmation. Combine price action with indicators like Bollinger Bands, RSI, Stochastic, ATR and MACD to confirm momentum, market conditions and volatility rather than replace your own chart reading.
Cut the noise, manage risk. Aligning trades with the dominant trend reduces whipsaw, clarifies entry and exit logic and supports disciplined risk management and journaling.
Apply it to real markets. The July 2024 yen episode shows how macro drivers can reshape currency moves; practice the top down analysis process on pairs like GBPUSD in a demo first, then go live with strict position sizing and documented rules.
What is Top Down Analysis in Forex
Top down analysis in trading is a method that starts with the big picture and then zooms into the details. In forex, top down analysis means reading macro data and long term charts first, then drilling into daily, four hour and one hour charts to find precise entry and exit points.
This approach keeps every trade aligned with the dominant market direction. Instead of reacting to random moves on a five or fifteen minute chart, you use top down analysis in forex to trade in the direction of higher time frame trends and avoid low quality setups.
Understanding the Forex Market as a Trader
Forex trading is the process of trying to benefit from changes in exchange rates between currency pairs such as EUR USD or GBP USD. The forex market is the largest financial market in the world and operates twenty four hours a day from Sunday to Friday, with trillions of dollars traded daily.
Currency pairs are grouped into major, minor and exotic categories. Major pairs like EUR USD and USD JPY are highly liquid, minors such as EUR AUD and GBP JPY remove the dollar but keep at least one major currency, while exotics such as USD SGD or EUR TRY combine a major with a less traded currency and usually show higher volatility and risk.
Basic Forex Trading Strategies
How do you start forex trading? The best approach for a newcomer to this market is to look at some of the basic forex trading strategies and choose which to begin with.
- Scalping is about trying to make regular, small profits, often just a few pips on several trades during the day. It requires a high degree of time commitment as it involves studying charts and indicators like moving averages as well as the support and resistance levels.
- Forex day trading is like scalping but with fewer trades each day. The main point with both these forex trading strategies is that you close your position before the end of the day. With day trading, you might just open and close one position each day rather than several. This put more emphasis on the need to study charts to understand the market fully before opening a position.
- Swing trading about identifying swings in the market and trying to gain a profit from them. A position may open for several days, meaning that you need to be patient and run the risk of overnight movement causing losses. You’ll want to use forex charts like candlestick charts and bar charts to help time your entry and exit points wisely.
- Position trading is an alternative way to carry out online forex trading. You’ll plan to hold your position longer in this case, meaning that your analysis is about finding long-term value. It doesn’t require as much time commitment as the shorter-term strategies above. Position trading puts the emphasis on fundamental analysis more than technical analysis, but you’ll still want to analyse support and resistance levels as well as moving averages and other technical indicators.
Tools and Forex Indicators for Top Down Analysis
Forex indicators can be used to guide trading decisions, although these expert recommendations are speculative, with no guarantee of profits or outcomes. Signals can be effective intel for those traders short on time or experience, and they can also help traders to understand more about how the market works.
Each Forex trading strategy can be used with specific indicators and tools to help traders understand the rationale behind market movements. These aides can be used to help counteract the fast-paced nature of these strategies and support objective, logical trading decisions.
One popular indicator commonly used are Bollinger Bands, which use standard deviation and moving averages to highlight market movements and provide bullish or bearish signals. The Relative Strength Indicator (RSI) is also commonly used to measure how fast the price of an asset is changing to identify trends and pressure levels to determine whether the asset is overbought or oversold.
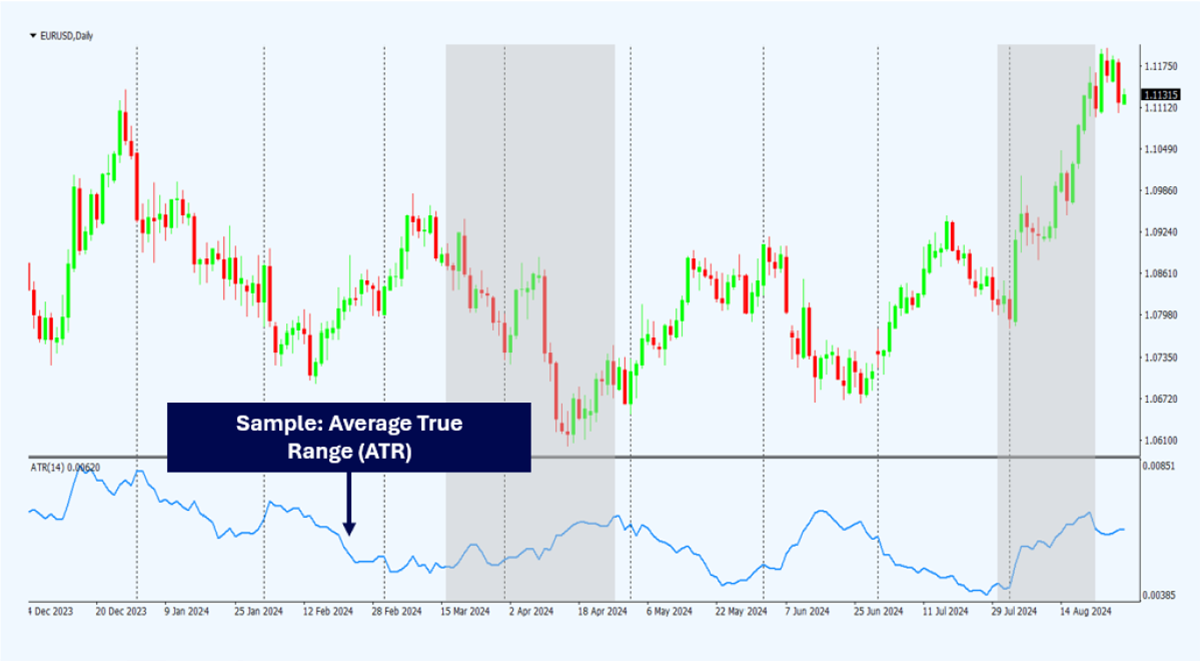
Technical analysis and price movements are also commonly utilised, such as simple moving averages on a candlestick chart and the Stochastic oscillator to highlight price momentum. Traders can also use indicators such as support and resistance levels, and average true ranges to inform decisions.
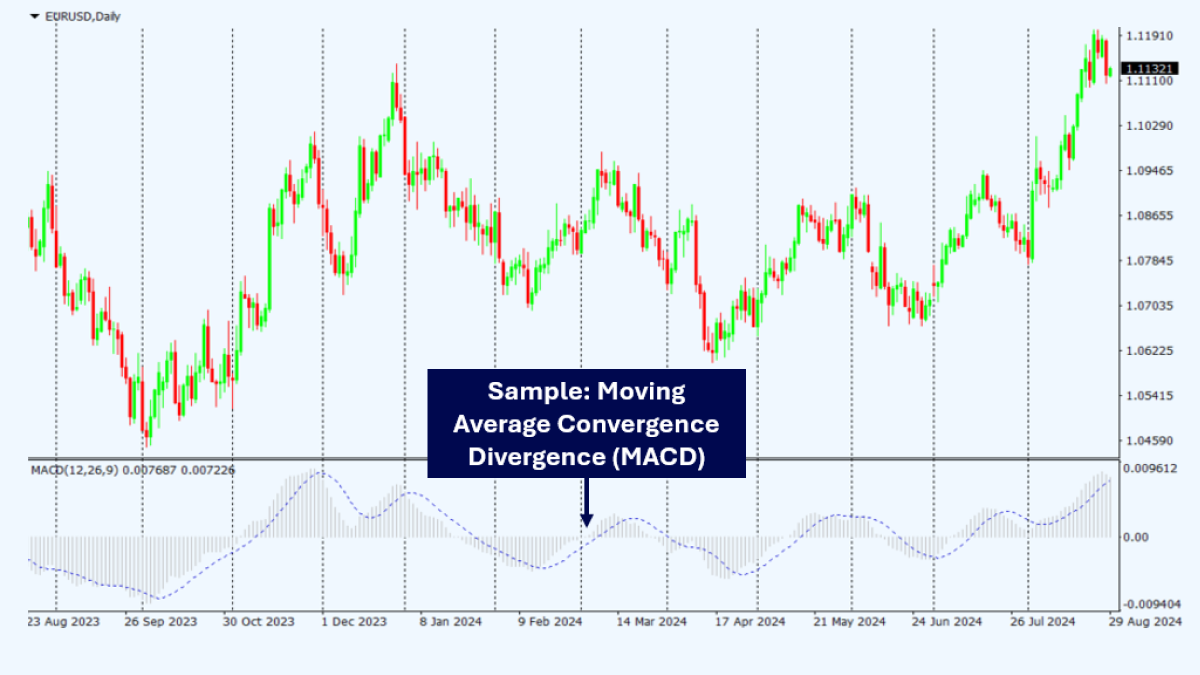
The MACD (Moving Average Convergence Divergence) is a popular momentum indicator used frequently in swing trading to identify potential uptrends or downtrends, as well as potential entry and exit points. Every trader will have indicators and tools that fit most logically with their strategy, which may depend on the stage of the trading journey and evolving financial ambitions.
The Power of Top-Down Analysis

It can be tempting to dive in and start trading a specific currency pair when learning forex trading. However, even the most experienced traders should undertake a top-down analysis to gain essential context and make informed trading decisions. This means gaining an overall picture of the market before narrowing the lens to focus on more specific trades.
A thorough top-down analysis will examine long-term chart data (e.g. daily or weekly charts) to identify overarching trends; traders can then build on this knowledge by examining shorter-term charts (e.g. one-hour or three-hour timeframe charts).
Data will build a picture of overall market direction, trends and activity surrounding bullish and bearish movements. It helps to avoid getting unduly influenced by short-term price movements by looking at a wider set of data through an in-depth technical lens.
An effective top-down analysis will identify support and resistance levels to establish informed risk management strategies such as stop-loss levels. It will also identify potential entry and exit points. Technical analysis will give context to minor or major upward and downward trends as well as bullish or bearish momentum, all of which come together to give a comprehensive image of the overall direction of the market.
This kind of top down market analysis stops you getting distracted by random intraday noise and keeps every trade aligned with the broader trend.
How to do Top Down Analysis in Forex Trading Step by Step
Top down analysis in forex trading follows a repeatable sequence:
- Assess Global Conditions. Look at world growth, inflation, interest rates, risk sentiment and major geopolitical themes.
Zoom in on countries and central banks. Study data and policy from the economies behind your chosen currencies, plus market expectations for rate changes.
Check higher time frame charts. On weekly and daily charts, mark the dominant trend, major support and resistance and key swing highs and lows.
Drop to trading time frames. On four hour and one hour charts, refine structure, look for pullbacks into key zones and watch how price reacts at levels.
Plan trades and manage risk. Decide direction, entry trigger, stop loss, target and position size so that each trade fits a clear top down analysis trading strategy.
An Example of Top-Down Analysis in the Forex Market
Suppose you want to trade GBP USD. You start by reviewing economic data and central bank commentary from the Bank of England and the Federal Reserve, plus market expectations for growth and interest rates in the UK and US. This builds a macro view of which currency might be stronger over the coming weeks.
Next, you study weekly and daily GBP USD charts to identify the main trend and key price zones, then drop to four hour or one hour charts to look for pullbacks, breakouts and clear candlestick patterns at those zones. Your final trade plan follows the higher time frame bias with defined entries, stops and targets.
Case Study: Informed Forex Trading

The July 2024 yen episode is a clear example of why top down analysis matters. After the yen fell to a multiyear low against the dollar, Japanese authorities intervened in the market and the Bank of Japan shifted away from negative interest rates, creating sharp reversals and volatility.
A trader using top down analysis would have followed these macro shifts, watched weekly and daily charts for exhaustion and reversal signals, then used shorter time frames to time entries with controlled risk. The case shows how combining macro drivers with clean chart structure can reveal high quality opportunities and keep you away from random trades.
Conclusion
Now that you understand the basics of forex trading, you may wish to try it for yourself to see if it suits your personality and if you feel comfortable with the ups and downs. The ever-evolving, fast-paced nature of this market won’t suit everyone but for those individuals who enjoy this style of trading, it can provide immense satisfaction and potentially healthy profits.
If you are intrigued by what you’ve learned in this guide, the next step is to put the theory into practice. Start by carrying out a top-down analysis that lets you get to grips with the market and feel that you’re starting to trade from a position of knowledge.
After that, you can start to assess the strategies for online forex trading that we’ve looked at here. They’ve each got some key advantages that make them right for certain traders, so you might like to give them a trial run with real-life trades to see which ones are perfect for you.
Carry on with further research to help build your confidence and knowledge levels, but don’t forget to make responsible risk management a priority. The situation can change rapidly in the forex market and even the best-researched predictions don’t always work out, so you need to have an exit strategy in place. Using controls like stop-loss orders helps to keep your funds safe and understanding how to use them should be one of your next priorities.


