

AUD/USD Price Forecast: Australia CPI in focus as pair consolidates below 0.7200 resistance
- AUD/USD trades in a tight range as traders await Australia’s April inflation data due on Wednesday.
- Australia’s annual inflation is expected to ease slightly to 4.4% in April from 4.6% in March.
- Technically, AUD/USD maintains a broader bullish structure while holding above key moving averages.
AUD/USD trades in a narrow range on Tuesday, even as the US Dollar (USD) strengthens on fading hopes for a quick resolution to the Middle East war after US forces carried out fresh strikes in southern Iran, overshadowing ongoing diplomatic efforts between Washington and Tehran. At the time of writing, the pair is trading around 0.7162, down 0.14% on the day.

The subdued price action comes as traders refrain from placing aggressive bets ahead of Australia’s inflation data due on Wednesday. Rising Energy prices linked to ongoing supply disruption concerns in the Middle East continue to fuel upside risks to inflation after Australia’s Consumer Price Index (CPI) accelerated to 4.6% YoY in March.
Economists expect Australia’s annual inflation to ease slightly to 4.4% in April, while the Reserve Bank of Australia's (RBA) closely watched Trimmed Mean CPI is forecast to edge higher to 3.4% YoY from 3.3% in March.
A stronger-than-expected inflation reading could reinforce expectations that the RBA may maintain its tightening bias for longer, potentially supporting the Australian Dollar (AUD).
In contrast, softer inflation data could further reduce near-term rate hike expectations, especially after Australia’s labor market showed signs of cooling. The unemployment rate unexpectedly rose to 4.5% in April, while Employment Change fell by 18.6K against expectations for a 17.5K increase.
Technical Analysis:
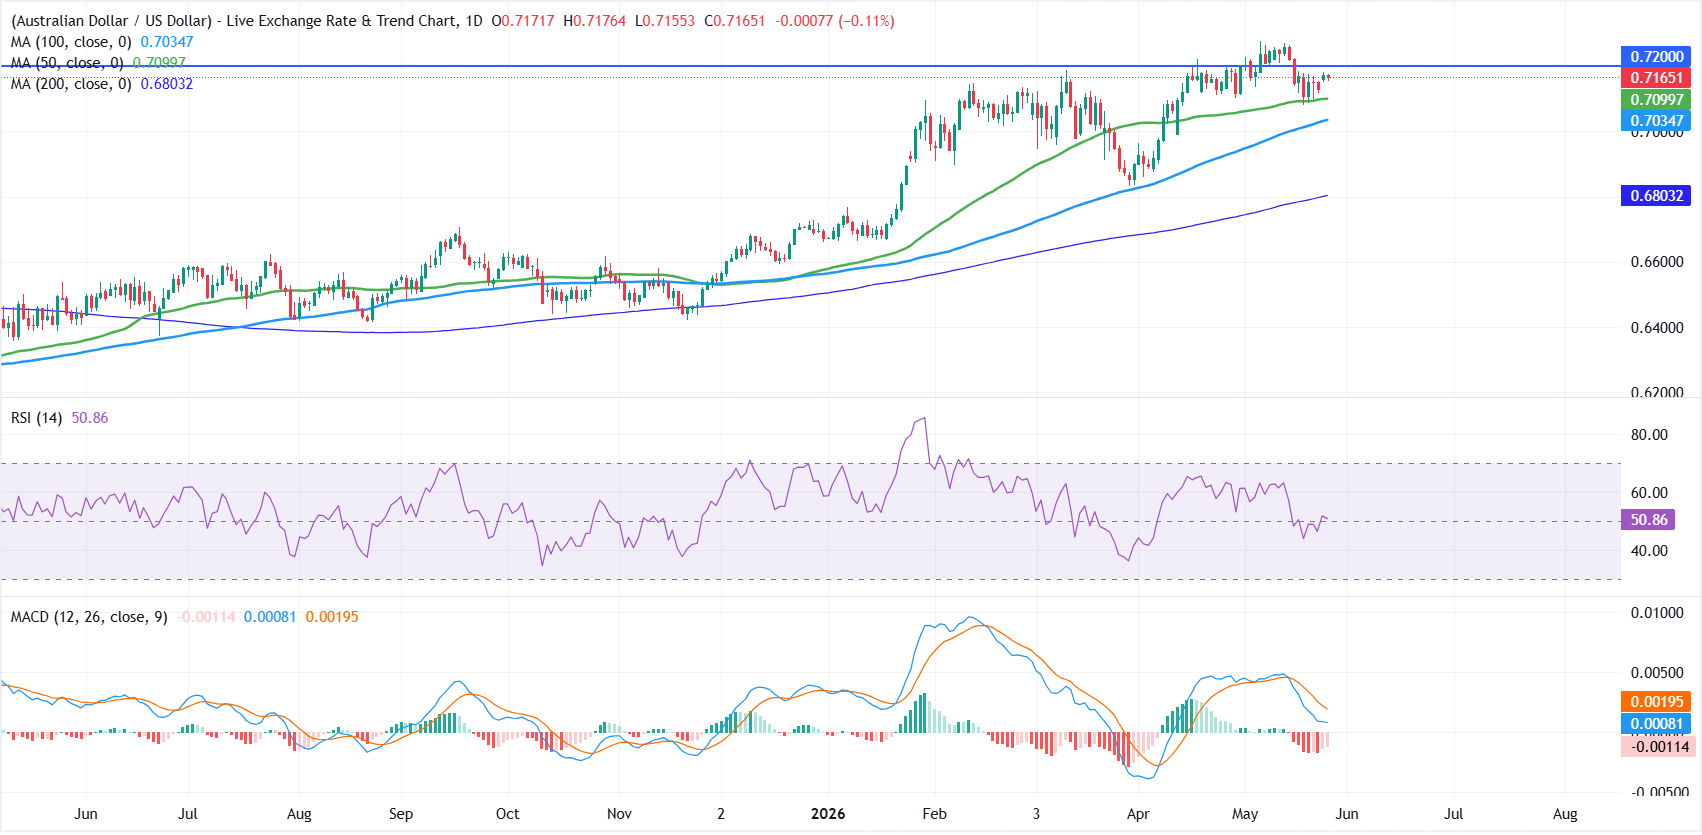
On the daily chart, AUD/USD maintains a constructive bullish bias as it holds above the 50-day, 100-day and 200-day Simple Moving Averages (SMAs) clustered between roughly 0.7100 and 0.6800.
The Relative Strength Index (RSI) near 51 signals neutral momentum after the recent pullback, while the Moving Average Convergence Divergence (MACD) has slipped slightly below zero, hinting that upside may be slowing but not yet reversing the broader positive structure.
On the topside, initial resistance is aligned with the horizontal cap at 0.7200, where a daily close higher would reopen the path toward fresh highs in the broader uptrend.
On the downside, immediate support is seen at the 50-day SMA around 0.7100, followed by the 100-day SMA near 0.7035. A deeper slide toward the 200-day SMA at 0.6803 would be needed to materially undermine the prevailing bullish outlook.
(The technical analysis of this story was written with the help of an AI tool.)
US Dollar Price Today
The table below shows the percentage change of US Dollar (USD) against listed major currencies today. US Dollar was the strongest against the New Zealand Dollar.
| USD | EUR | GBP | JPY | CAD | AUD | NZD | CHF | |
|---|---|---|---|---|---|---|---|---|
| USD | 0.16% | 0.45% | 0.29% | 0.10% | 0.11% | 0.65% | 0.41% | |
| EUR | -0.16% | 0.33% | 0.11% | -0.05% | -0.01% | 0.51% | 0.24% | |
| GBP | -0.45% | -0.33% | -0.19% | -0.36% | -0.33% | 0.19% | -0.07% | |
| JPY | -0.29% | -0.11% | 0.19% | -0.18% | -0.14% | 0.36% | 0.13% | |
| CAD | -0.10% | 0.05% | 0.36% | 0.18% | 0.05% | 0.57% | 0.32% | |
| AUD | -0.11% | 0.01% | 0.33% | 0.14% | -0.05% | 0.52% | 0.27% | |
| NZD | -0.65% | -0.51% | -0.19% | -0.36% | -0.57% | -0.52% | -0.26% | |
| CHF | -0.41% | -0.24% | 0.07% | -0.13% | -0.32% | -0.27% | 0.26% |
The heat map shows percentage changes of major currencies against each other. The base currency is picked from the left column, while the quote currency is picked from the top row. For example, if you pick the US Dollar from the left column and move along the horizontal line to the Japanese Yen, the percentage change displayed in the box will represent USD (base)/JPY (quote).














