

Trading
Esplora una vasta gamma di mercati con prezzi competitivi, elevata liquidità e strumenti di trading avanzati.
Scopri di più 
Piattaforma
Fai trading senza problemi con la potente piattaforma di TMGM, fatta apposta per essere veloce, precisa e per darti un'esperienza di trading fantastica.
Scopri di più Piattaforma di trading
Strumenti di trading
Academy
Impara le basi del trading con le risorse per principianti, tra cui guide, webinar e approfondimenti sul mercato.
Scopri di più Notizie e analisi
Ricevi aggiornamenti sul mercato in tempo reale e analisi di esperti per cogliere le opportunità di trading
Scopri di più Notizie e analisi
Chi siamo
Scopri cosa rende TMGM speciale: la nostra presenza globale, la nostra forza normativa e il nostro impegno per l'innovazione nel trading.
Scopri di più Perché scegliere TMGM
Sponsorizzazioni
Chainlink Price Forecast: Short-term correction in LINK risks a bearish reversal to $10
- Chainlink is down over 3% on Wednesday, pressuring the crucial support level at $13.19.
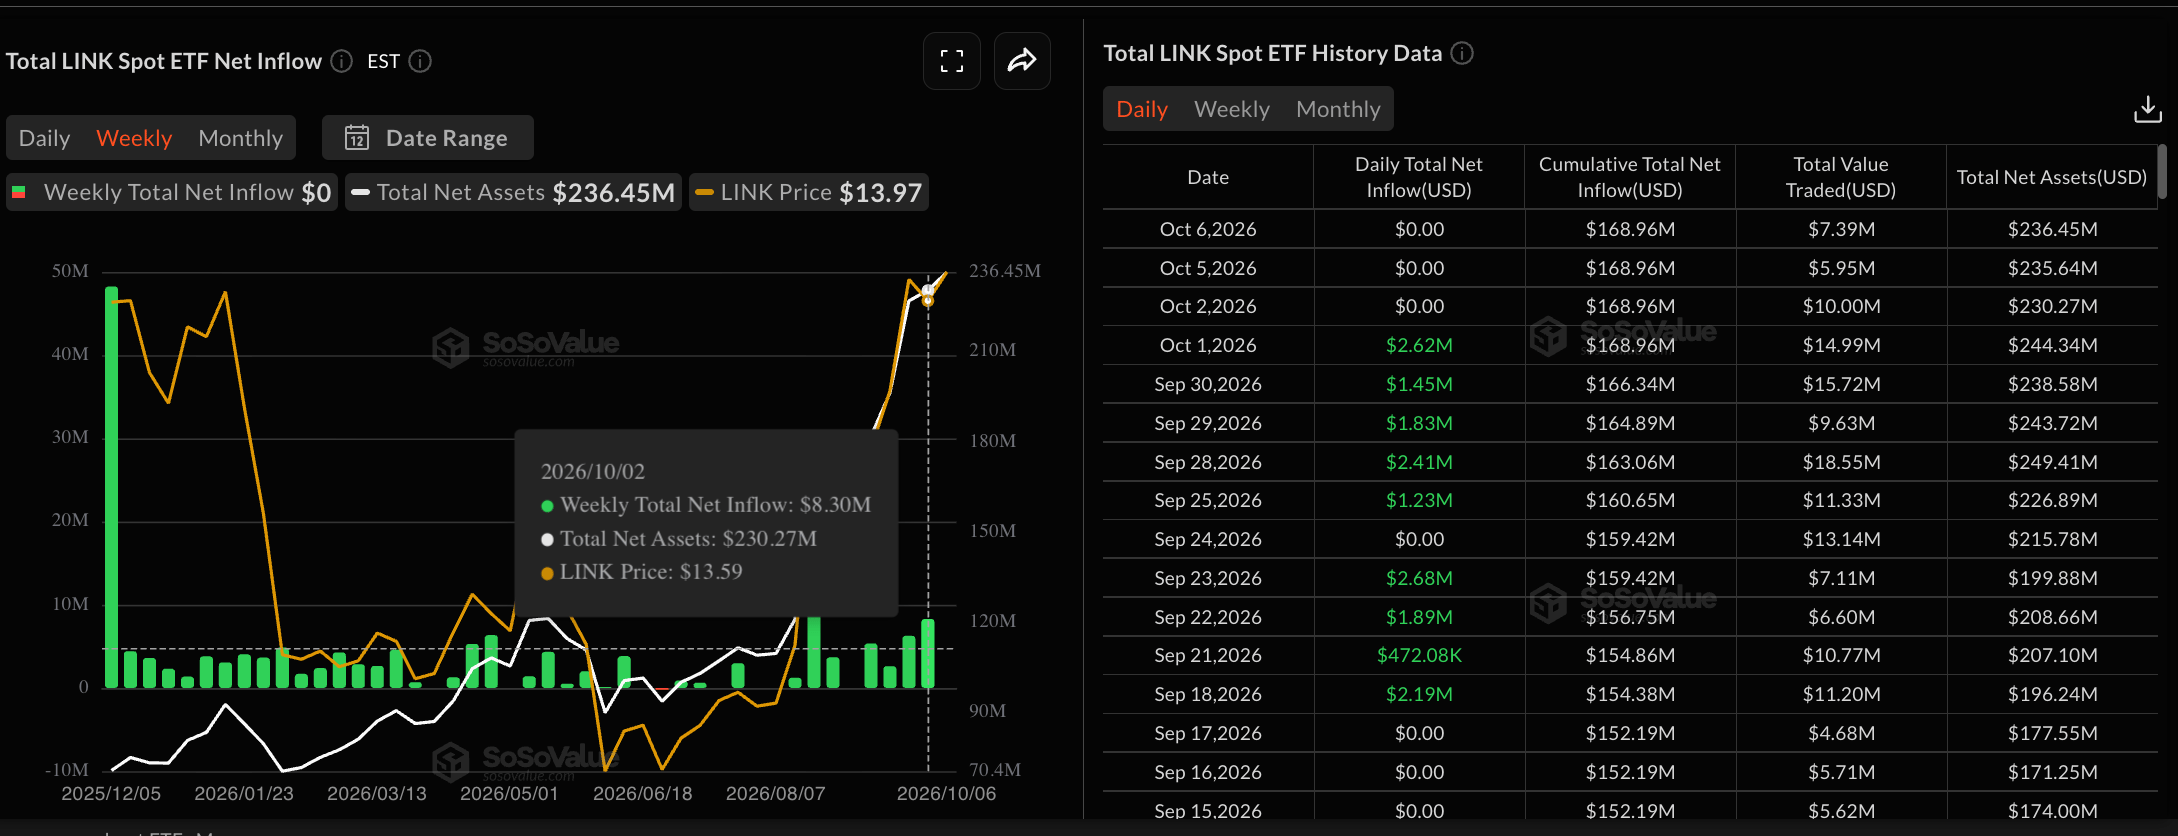
- Institutional demand remains muted so far this week, with zero inflows, down from $8.30 million the previous week.
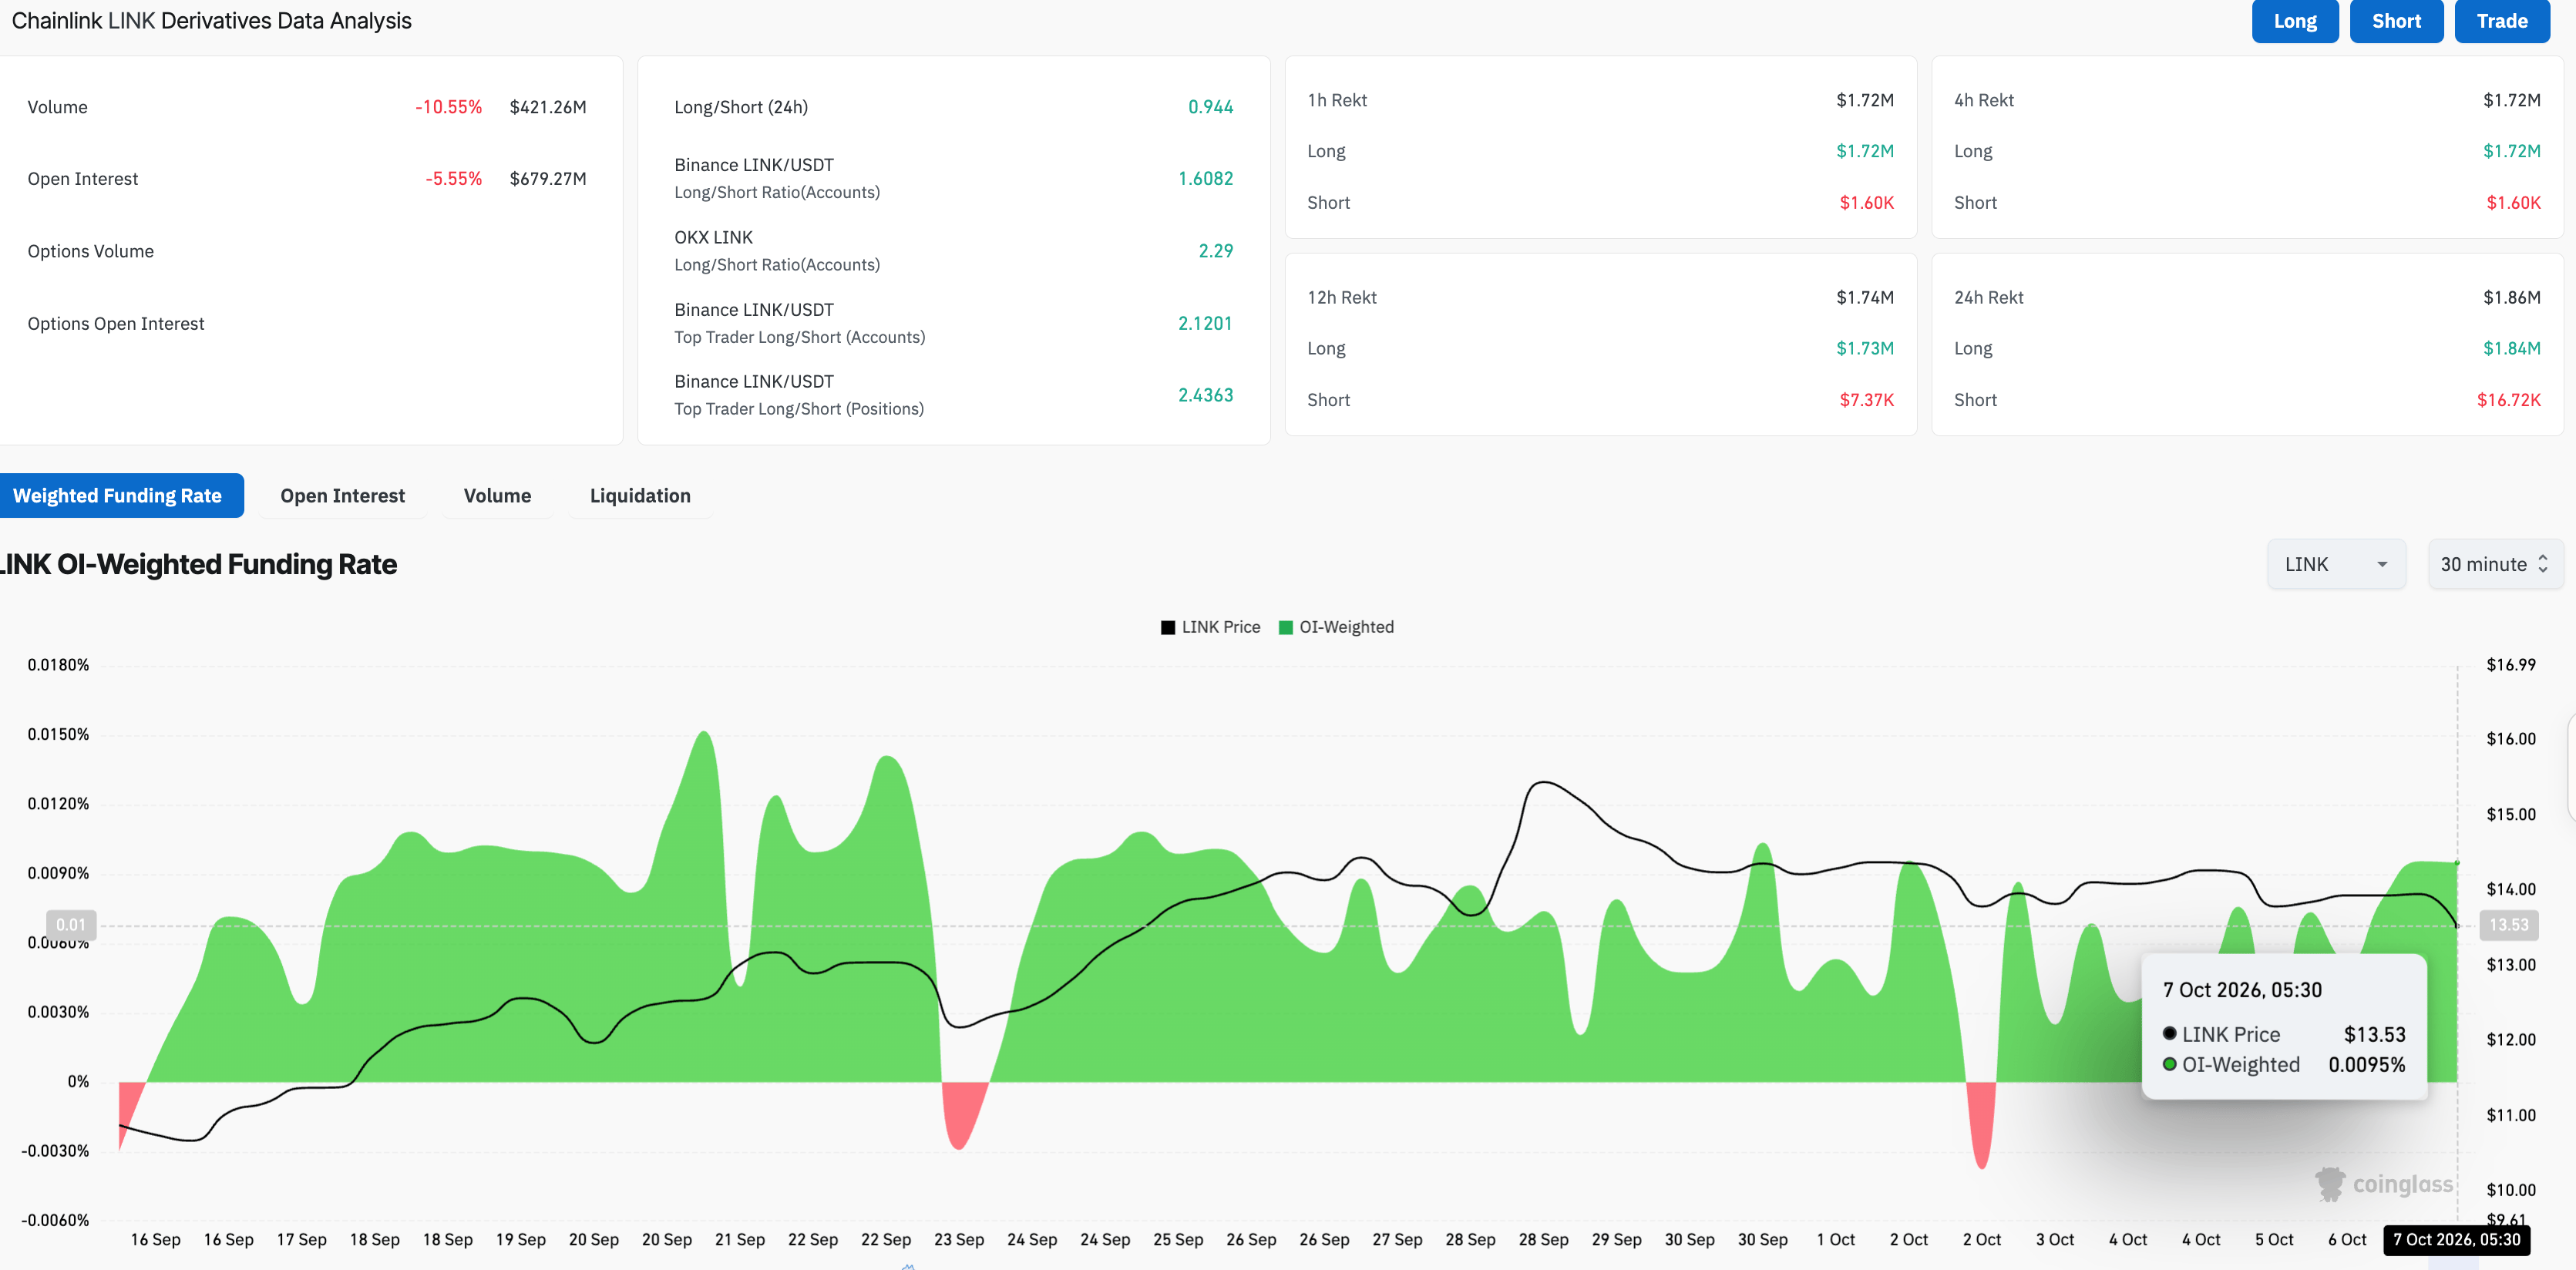
- Derivatives data shows a decline of over 5% in Open Interest over the last 24 hours, suggesting reduced exposure.
Chainlink (LINK) is down over 3% at press time on Wednesday, facing short-term weakness as institutional and retail demand eases. LINK-focused Exchange Traded Funds (ETFs) witnessed three consecutive days of zero inflows, while LINK futures Open Interest (OI) is down over 5%, suggesting a mild positional wipeout. The technical outlook for LINK is mixed, with a crucial support level near $13.19 in focus.

Declining retail and institutional inflows weigh on Chainlink
Chainlink is facing muted institutional inflows so far this week. SoSoValue data shows LINK-focused ETFs recorded zero inflows over the last three consecutive days, down from $8.30 million recorded last week. Despite zero inflows, LINK ETFs have seen little selling pressure from investor redemptions, with the last daily outflow of $390,580 recorded on August 13.
On the retail side, Chainlink futures show easing leverage exposure among traders. According to CoinGlass data, LINK Open Interest (OI) is down 5.55% over the last 24 hours to $679.27 million, suggesting a decline in the notional value of active positions, likely due to a lower spot price or a positional wipeout. Total liquidations of $1.86 million in the same period, driven by $1.84 million of long liquidations, reaffirms the positional wipeout thesis and a sell-side dominance.
Technical outlook: Chainlink faces downside risk as bearish momentum emerges
Chainlink trades below $13.50 at press time on Wednesday, extending a pullback from an overhead trendline near $14.00. The 50-period Exponential Moving Average (EMA) on the four-hour chart near $14.00 reinforces the overhead barrier.
Chainlink maintains a bearish near-term bias as its price trades below the 100-period EMA at $13.68, while the longer-term 200-period EMA at $12.87 remains lower, suggesting an intact broader uptrend.
Momentum is weak, with the Moving Average Convergence Divergence (MACD) declining into negative territory and the Relative Strength Index (RSI) at slipping below the midline, reinforcing the downside bias.
Looking down, immediate support is defined by the September 25 low around $13.10, ahead of the 200-period EMA at $12.87, where buyers would be expected to defend the larger bullish structure.
To reinstate an uptrend, LINK must reclaim the 50-period EMA and the active downward-sloping resistance trendline near $14.00. A confirmed breakout could extend toward last week's high around $15.77.
(The technical analysis of this story was written with the help of an AI tool. Know more.)
ARTICOLI POPOLARI
1Dogecoin Price Forecast: Extended correction and weakening momentum raise downside risks2WTI Price Forecast: Sticks to gains near $89.50; bulls seem hesitant below 200-SMA on H43Quant Price Forecast: QNT rally capped at key resistance poses bearish reversal risk4USD/INR remains broadly muted after RBI’s 25 bps hike in Repo Rates to 5.5%5India Gold price today: Gold falls, according to FXStreet data6Gold weakens amid renewed USD strength and higher bond yields, ahead of FOMC Minutes7EUR/JPY Price Forecast: Slips below 178.00 after pulling back from nine-day EMA8EUR/USD Price Forecast: More downside likely below 1.11609Silver Price Forecast: XAG/USD remains below $61.00 as oil prices surge
QUOTAZIONI IN DIRETTA


TUTTO SU TECHNICAL
Che cos'è il trading ICT? Spiegazione dei concetti dell'Inner Circle Trader
Supporto e Resistenza: significato, tipologie, come tracciare i livelli e strategie di trading
Che cos'è la liquidità? Significato nel trading e nei mercati finanziari
Liquidity Sweep: Significato, esempi e strategia di trading
Struttura del mercato nel trading: la guida completa (rialzista, ribassista, laterale)
Cambiamento di Carattere (CHoCH): Definizione, Esempi e Strategia
Che cos'è il pattern Dark Cloud Cover e come si opera con esso?
Che cos'è il pattern candlestick Piercing Line e come si fa trading con esso?
Cosa sono i pattern di candele Tweezer Top e Tweezer Bottom?
Inizia ora!
Registrati e accedi ai mercati globali in meno di 3 minuti

Contattaci









Contatti
Telefono: +61 2 8036 8388
Fax: +61 2 8036 8388
Email: support@tmgm.com
Web: https://www.tmgm.com



Le informazioni fornite su questo sito web hanno esclusivamente carattere generale e non costituiscono consulenza finanziaria personalizzata. Prima di agire sulla base di qualsiasi informazione presente su questo sito web, dovresti valutarne l'adeguatezza in relazione ai tuoi obiettivi, alla tua situazione finanziaria e alle tue esigenze. Investire in CFD e contratti FX con margine comporta rischi significativi e non è adatto a tutti gli investitori. Potresti perdere più del tuo deposito iniziale. Non possiedi, né hai, alcun interesse nell'attività sottostante. Ti raccomandiamo di richiedere una consulenza indipendente e di assicurarti di comprendere pienamente i rischi connessi prima di fare trading. È importante leggere e valutare il documento informativo prima di acquisire qualsiasi prodotto elencato sul sito web. Le informazioni e le pubblicità offerte su questo sito web non sono destinate all'uso da parte di persone in paesi o giurisdizioni in cui tale utilizzo sarebbe contrario alle leggi e ai regolamenti locali. I Prodotti e Servizi offerti su questo sito web non sono destinati ai residenti degli Stati Uniti, della Malesia e della Thailandia.
TMGM è autorizzata e regolamentata in diverse giurisdizioni.
Trademax Australia Limited, operante come TMGM, è regolamentata dalla Australian Securities and Investments Commission (ASIC), AFSL n. 436416 e si trova a Level 28, One International Tower, 100 Barangaroo Avenue, 2000 Sydney, NSW Australia.
Email: support@tmgm.com.au
Trademax Global Limited, operante come TMGM, è autorizzata e regolamentata dalla Vanuatu Financial Services Commission (VFSC), numero di registrazione 40356 e registrata a 1276, Kumul Highway, Port Vila, Vanuatu, Repubblica di Vanuatu.
Email: support@tmgm.com
Trademax Global Markets (SE) Limited, operante con il nome TMGM, è autorizzata e regolamentata dalla Financial Services Authority (FSA) delle Seychelles, con numero di licenza SD224. La società è registrata presso l’Ufficio n. 13, Providence Estate ABIS Centre, Mahé, Seychelles.
Email: support@tmgm.com
Trademax Global Markets (International) Pty Ltd, operante come TMGM, è autorizzata e regolamentata dalla Financial Services Commission, Mauritius (FSC) con licenza n. GB22201012, e registrata al 33, Edith Cavell Street C/o IQ EQ Fund Services (Mauritius) Ltd Port Louis, 11324 Mauritius.
Email: support@tmgm.com
Copyright © TMGM. Tutti i diritti riservati