
Silver Price Forecasts: XAG/USD hits two-week lows near $73 with central banks in focus
Di Guillermo Alcala
Aggiornato: 28 Apr 2026


ARTICOLI POPOLARI

Silver (XAG/USD) accelerated its downtrend on Tuesday, to hit fresh two-week lows at $73.35 at the time of writing, as markets shift focus from the war to the world’s major central banks, which will release their monetary policy decisions this week.
- Silver dips to two-week lows near $73,00 ahead of a slew of central banks' monetary policy decisions.
- Market expectations of a global tightening cycle are weighing on demand for precious metals.
- XAG/USD's next bearish target is the $72.65 area.
Silver (XAG/USD) accelerated its downtrend on Tuesday, to hit fresh two-week lows at $73.35 at the time of writing, as markets shift focus from the war to the world’s major central banks, which will release their monetary policy decisions this week.
The energy shock stemming from the Middle East conflict has boosted inflationary pressures around the globe, pressuring central banks to keep their monetary policies steady or, in some cases, to hike interest rates in the coming months. The non-yielding precious metals tend to struggle in monetary tightening cycles.
Meanwhile, the US-Iran conflict remains in a deadlock, with the Strait of Hormuz closed, supporting Crude prices nearly 50% above pre-war levels, providing support to the safe-haven US Dollar (USD) and adding weight to precious metals. A Reuters report citing a US official says that US President Donald Trump analysed Tehran´s latest peace proposal but that he “does not love it”, because it does not address the nuclear issue.
Technical Analysis: Bears are aiming for the $72.60 area
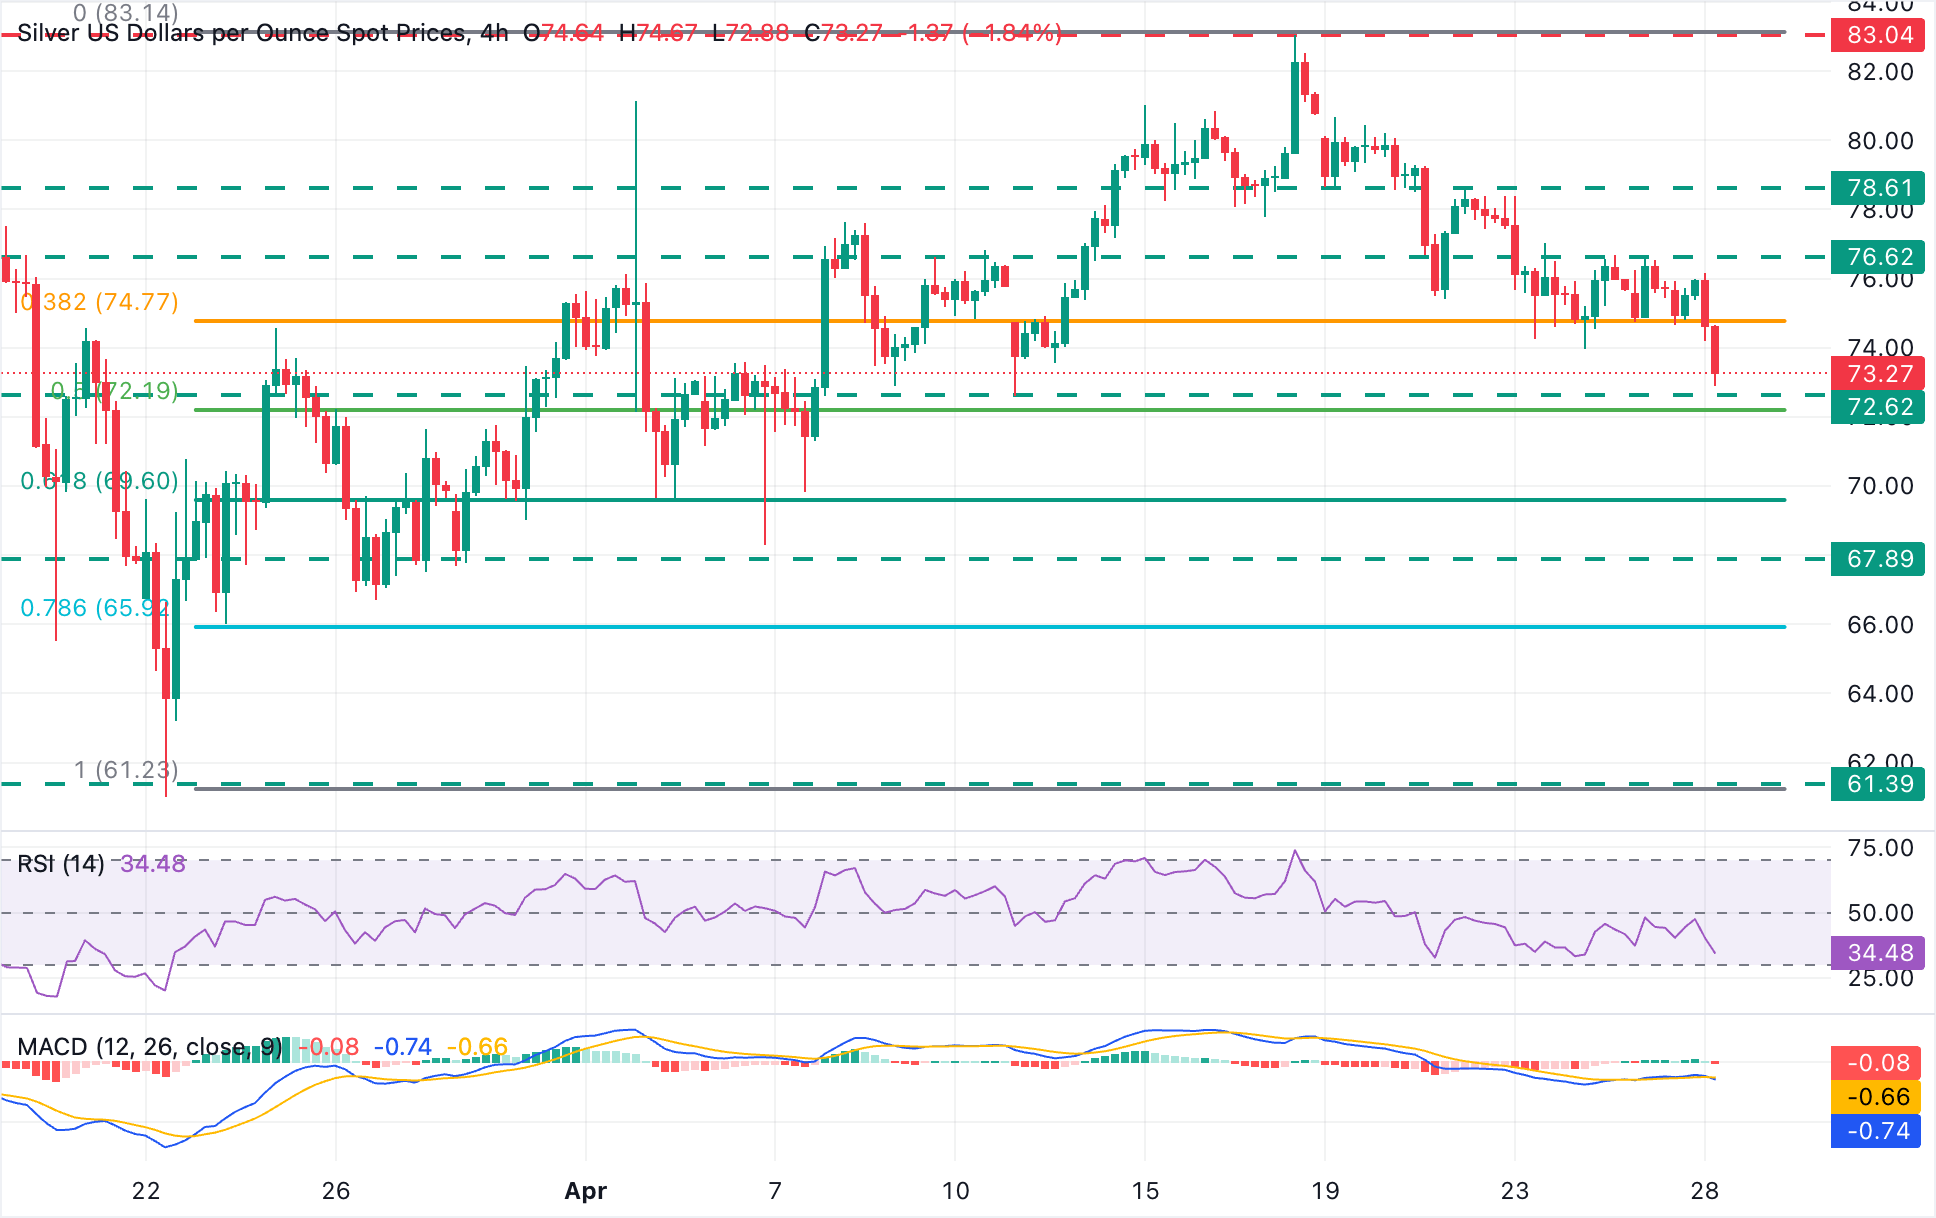
XAG/USD holds a steady bearish bias from mid-April highs above $83.00, with no sign of a trend shift in sight so far. The negative technical indicators on the 4-hour chart endorse that view. The Relative Strength Index (RSI) sits around 35, and the Moving Average Convergence Divergence (MACD) remains marginally negative, which together suggest lingering downside pressure.
Bears have broken support at the 38.2% Fibonacci retracement of the late March-early April bullish trend, around $74.70, and are aiming for the area between the April 12 low, near $72 60, and the 50% Fibonacci level, at $72.12. Further down, the 61.8% Fibonacci retracement lies right below the $70.00 psychological level.
On the topside, the mentioned the 38.2% Fibonacci retracement at $74.70 is likely to act now as resistance ahead of Monday's and Friday's highs, around $76.60, and the April 22 and 23 highs, near $78.50.
(The technical analysis of this story was written with the help of an AI tool.)
Silver FAQs
Silver is a precious metal highly traded among investors. It has been historically used as a store of value and a medium of exchange. Although less popular than Gold, traders may turn to Silver to diversify their investment portfolio, for its intrinsic value or as a potential hedge during high-inflation periods. Investors can buy physical Silver, in coins or in bars, or trade it through vehicles such as Exchange Traded Funds, which track its price on international markets.
Silver prices can move due to a wide range of factors. Geopolitical instability or fears of a deep recession can make Silver price escalate due to its safe-haven status, although to a lesser extent than Gold's. As a yieldless asset, Silver tends to rise with lower interest rates. Its moves also depend on how the US Dollar (USD) behaves as the asset is priced in dollars (XAG/USD). A strong Dollar tends to keep the price of Silver at bay, whereas a weaker Dollar is likely to propel prices up. Other factors such as investment demand, mining supply – Silver is much more abundant than Gold – and recycling rates can also affect prices.
Silver is widely used in industry, particularly in sectors such as electronics or solar energy, as it has one of the highest electric conductivity of all metals – more than Copper and Gold. A surge in demand can increase prices, while a decline tends to lower them. Dynamics in the US, Chinese and Indian economies can also contribute to price swings: for the US and particularly China, their big industrial sectors use Silver in various processes; in India, consumers’ demand for the precious metal for jewellery also plays a key role in setting prices.
Silver prices tend to follow Gold's moves. When Gold prices rise, Silver typically follows suit, as their status as safe-haven assets is similar. The Gold/Silver ratio, which shows the number of ounces of Silver needed to equal the value of one ounce of Gold, may help to determine the relative valuation between both metals. Some investors may consider a high ratio as an indicator that Silver is undervalued, or Gold is overvalued. On the contrary, a low ratio might suggest that Gold is undervalued relative to Silver.

Oltre un milione di utenti si affida a FXStreet per dati di mercato in tempo reale, strumenti di charting, approfondimenti di esperti e notizie Forex. Il loro calendario economico completo e i webinar formativi aiutano i trader a rimanere informati e a prendere decisioni ponderate. FXStreet conta circa 60 professionisti tra la sede di Barcellona e diverse regioni globali.
Leggi di più


