

Perdagangan
Terokai pelbagai pasaran dengan harga yang kompetitif, kecairan yang mendalam, dan alat perdagangan yang canggih.
Ketahui Lebih Lanjut 
Platform
Berdagang dengan lancar menggunakan platform berkuasa TMGM, dibina untuk kelajuan, ketepatan, dan pengalaman perdagangan yang unggul.
Ketahui Lebih Lanjut Platform Perdagangan
Akademi
Pelajari asas perdagangan dengan sumber yang mesra pemula, termasuk panduan, webinar, dan wawasan pasaran.
Ketahui Lebih Lanjut Akademi TMGM
Berita & Analisis
Dapatkan kemas kini pasaran masa nyata dan analisis pakar untuk kekal mendahului peluang perdagangan
Ketahui Lebih Lanjut Berita & Analisis
Tentang
Ketahui apa yang membezakan TMGM — kehadiran global kami, kekuatan kawal selia, dan komitmen terhadap inovasi dalam perdagangan.
Ketahui Lebih Lanjut Mengapa Pilih TMGM
Cardano Price Forecast: Eyes gains as derivatives metrics strengthen
- Cardano hovers around $0.270 on Tuesday after gaining over 4% the previous day.
- ADA’s Node Diversity Celebration Day brings developers together to discuss node implementations and development progress.
- Strengthening derivatives metrics and a constructive technical outlook support further gains.
Cardano (ADA) steadies around $0.270 on Tuesday after gaining over 4% at the start of the week on Monday. Bullish sentiment is boosted as Cardano’s Node Diversity Celebration Day goes live on Tuesday, highlighting ongoing efforts to strengthen network decentralization, security and resilience. Meanwhile, strengthening in the derivatives market and a constructive technical outlook suggest ADA may have room for further gains.

Cardano Node Diversity Celebration Day
Cardano announced in an X post on Tuesday that its Node Diversity Celebration Day has gone live at the TOKEN2049 event in Singapore.
“This workshop brings together representatives from across the Cardano node ecosystem for three hours of discussions, progress updates and timelines, giving the community a look at the range of work happening around independent node implementations,” said Cardano on its X post.
The program focuses on how node diversity can strengthen decentralization, security and resilience while providing updates from node developers and outlining the next phase of Cardano’s efforts to expand node diversity.
This suggests Cardano is strengthening network decentralization and resilience, which could improve investor sentiment around ADA.
Strengthening derivatives outlook
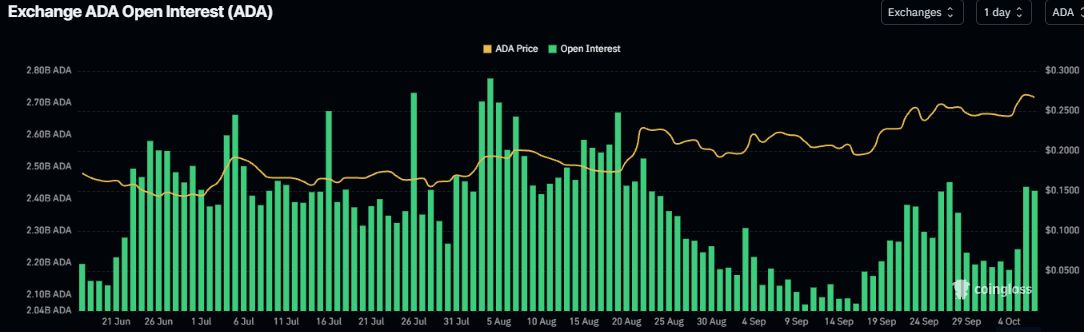
Cardano’s derivatives metrics show strengthening conditions. CoinGlass’ Open Interest (OI) chart for ADA has surged across exchanges since early October, with outstanding contracts reaching 2.44 billion ADA on Tuesday, nearing the September highs. The rise in OI, alongside surging prices and volume, suggests new long positions are entering the market, signaling a bullish outlook.
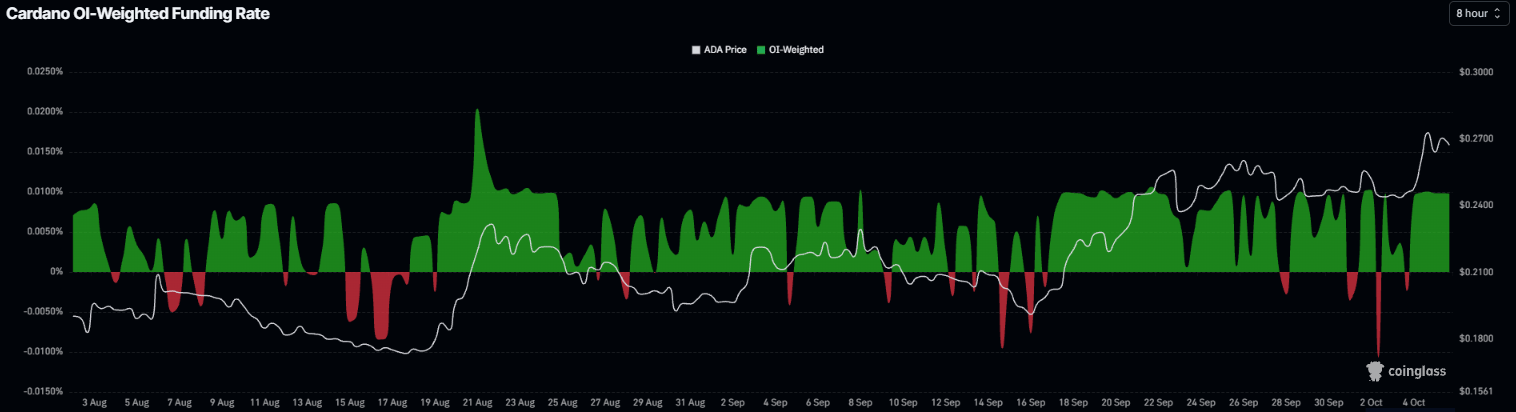
In addition, Cardano’s funding rate flipped positive on Sunday and rose to 0.0098% on Tuesday. This indicates longs are paying shorts, reflecting a bullish outlook for ADA.
Cardano technical outlook: Bulls target $0.300 mark
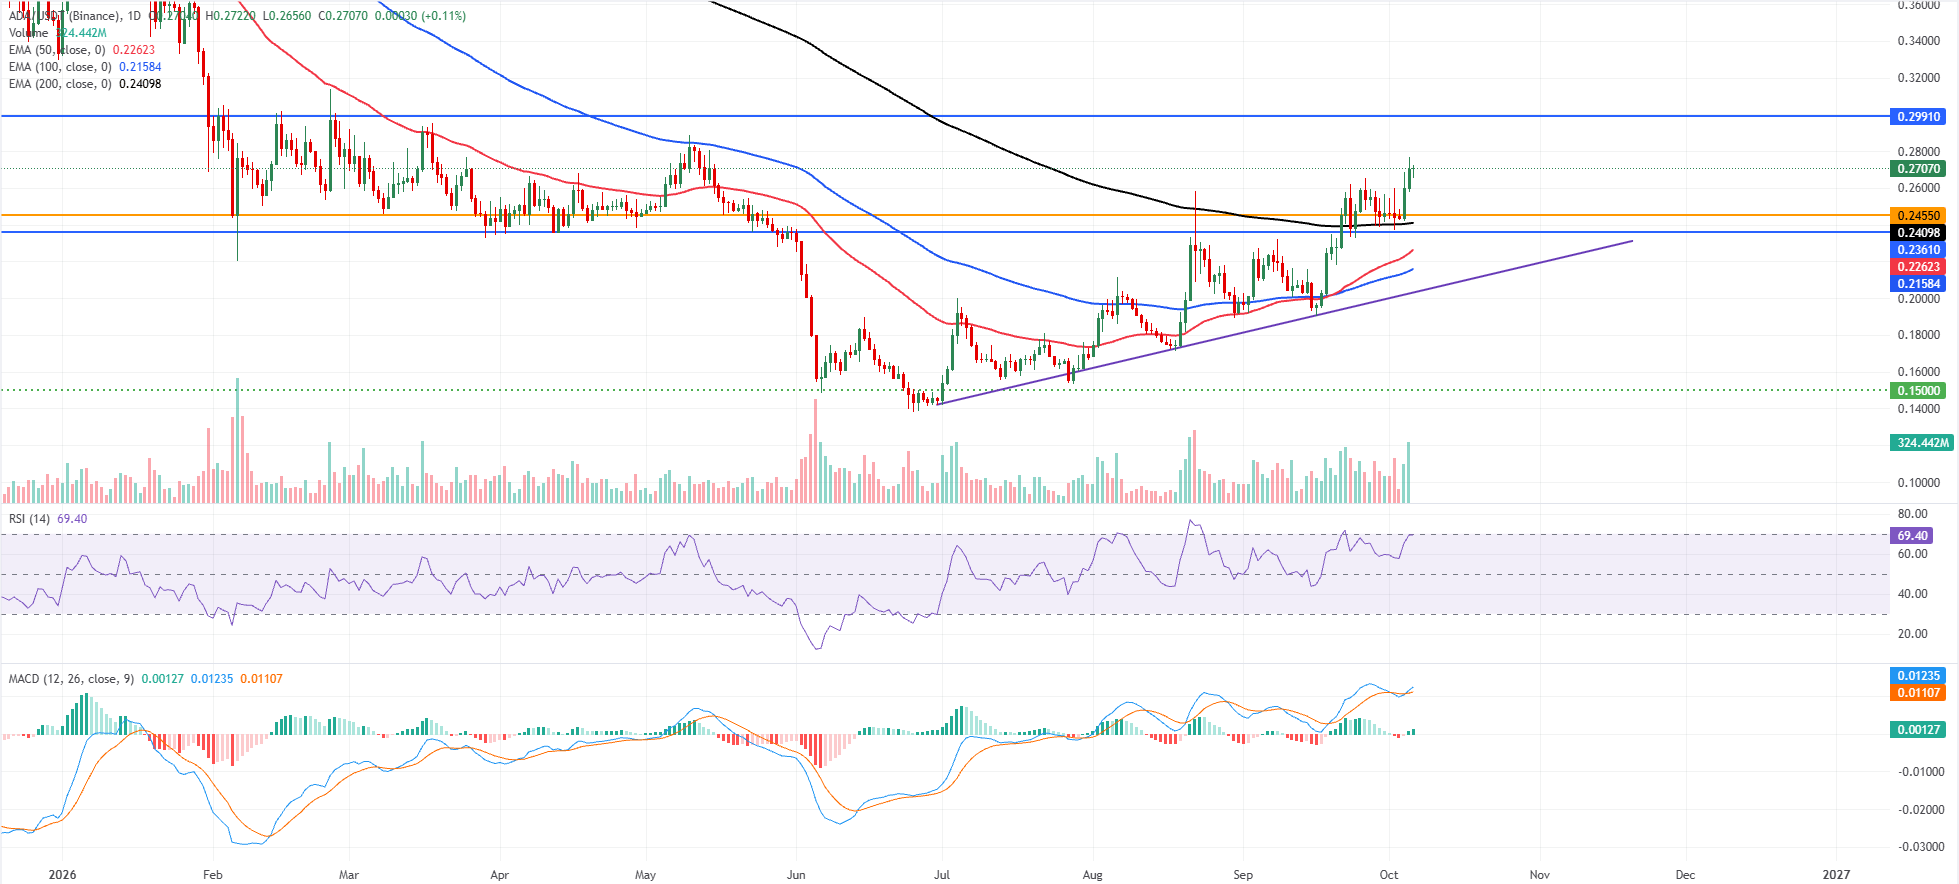
Cardano price trades at $0.270 on Tuesday, extending its advance above the 50-day, 100-day and 200-day Exponential Moving Averages (EMAs), which collectively underpin a bullish near-term bias.
ADA is comfortably supported by the 200-day EMA around $0.240 and the mid-$0.240 horizontal floor at $0.245, while the Relative Strength Index (RSI) hovers just below overbought territory near 69, hinting at strong but stretched upside momentum. The Moving Average Convergence Divergence (MACD) indicator remains positive, with the signal line above zero, reinforcing the constructive tone despite the latest sharp run-up.
On the downside, initial support is seen at the $0.245 horizontal level, followed by the 200-day EMA near $0.240 and a secondary cushion at $0.236. Deeper pullbacks would expose the 50-day EMA around $0.226 and the 100-day EMA near $0.215, ahead of the former trendline break area around $0.203 and the more distant $0.150 base.
On the topside, ADA faces its next major barrier at the horizontal resistance level clustered near $0.299, where a clear break and daily close would open the door to an uptrend extension. At the same time, failure to overcome this cap could trigger a corrective phase back toward the $0.240–$0.250 support band.
(The technical analysis of this story was written with the help of an AI tool. Know more.)
ARTIKEL POPULAR
1Canadian Dollar softens as oil prices fall2Indian Rupee faces pressure from higher bond yields, FIIs outflow3-10.6%: Germany’s Factory Orders fall in August, missed -1.0% estimates4Hyperliquid Price Forecast: $14.5M USDC yield to sponsor HYPE buybacks5Cardano Price Forecast: Eyes gains as derivatives metrics strengthen6WTI Price Forecast: Bulls seem hesitant near $89.00 amid easing supply risks7Gold hits two-month low as bears await break below $4,100 amid sustained USD strength8AUD/JPY Price Forecast: Strengthens above 110.00, while bearish technical bias persists9EUR/JPY Price Forecast: Tests 177.50 after rebounding from descending channel bottom
SEBUT HARGA LANGSUNG


Berhubung Dengan Kami









Hubungan
Telefon: +61 2 8036 8388
Faks: +61 2 8036 8388
E-mel: support@tmgm.com
Laman Web: https://www.tmgm.com



Maklumat yang disediakan di laman web ini adalah bersifat umum sahaja dan tidak merupakan nasihat kewangan peribadi. Sebelum bertindak berdasarkan sebarang maklumat di laman web ini, anda harus mempertimbangkan kesesuaian maklumat tersebut berhubung dengan objektif, keadaan kewangan dan keperluan anda. Pelaburan dalam CFD dan Kontrak Margin FX melibatkan risiko yang ketara dan tidak sesuai untuk semua pelabur. Anda mungkin mengalami kerugian melebihi deposit awal anda. Anda tidak memiliki, atau mempunyai, sebarang kepentingan dalam aset pendasar. Kami mengesyorkan agar anda mendapatkan nasihat bebas dan memastikan anda memahami sepenuhnya risiko yang terlibat sebelum berdagang. Adalah penting untuk anda membaca dan mempertimbangkan dokumen pendedahan sebelum anda memperoleh sebarang produk yang disenaraikan di laman web ini. Maklumat dan iklan yang ditawarkan di laman web ini tidak bertujuan untuk digunakan oleh mana-mana individu di mana-mana negara atau bidang kuasa yang penggunaan sedemikian akan bercanggah dengan undang-undang dan peraturan tempatan. Produk dan Perkhidmatan yang ditawarkan di laman web ini tidak ditujukan kepada penduduk Amerika Syarikat, Malaysia dan Thailand.
TMGM diberi kuasa dan dikawal selia dalam pelbagai bidang kuasa.
Trademax Australia Limited, berdagang sebagai TMGM, dikawal selia oleh Suruhanjaya Sekuriti dan Pelaburan Australia (ASIC), AFSL no. 436416 dan terletak di Aras 28, One International Tower, 100 Barangaroo Avenue, 2000 Sydney, NSW Australia.
E-mel: support@tmgm.com.au
Trademax Global Limited, berdagang sebagai TMGM, diberi kuasa dan dikawal selia oleh Suruhanjaya Perkhidmatan Kewangan Vanuatu (VFSC), nombor pendaftaran 40356 dan didaftarkan di 1276, Kumul Highway, Port Vila, Vanuatu, Republik Vanuatu.
E-mel: support@tmgm.com
Trademax Global Markets (SE) Limited, yang beroperasi sebagai TMGM, dilesenkan dan dikawal selia oleh Pihak Berkuasa Perkhidmatan Kewangan (FSA) Seychelles, dengan nombor lesen SD224. Syarikat ini didaftarkan di Pejabat No. 13, Providence Estate ABIS Centre, Mahe, Seychelles.
E-mel: support@tmgm.com
Trademax Global Markets (International) Pty Ltd, berdagang sebagai TMGM, diberi kuasa dan dikawal selia oleh Suruhanjaya Perkhidmatan Kewangan, Mauritius (FSC) dengan lesen no. GB22201012, dan didaftarkan di 33, Edith Cavell Street C/o IQ EQ Fund Services (Mauritius) Ltd Port Louis, 11324 Mauritius.
E-mel: support@tmgm.com
Hak Cipta © TMGM. Semua hak terpelihara