

Enjin Coin Price Forecast: ENJ extends losses as bearish pressure builds
- Enjin Coin price extends losses on Tuesday, following a more than 6% decline over the previous two days.
- Weakening on-chain data and rising short bets in the derivatives markets support a bearish outlook.
- The technical outlook supports a deeper correction as momentum shows early signs of weakness.
Enjin Coin (ENJ) price slips below $0.059 on Tuesday, extending its correction by over 6% in the previous two days. The bearish price action is supported by weakening on-chain and derivatives data, which shows growing short positioning. On the technical side, fading momentum indicators signal the risk of a deeper correction for the ENJ token.

Bulls reaching exhaustion
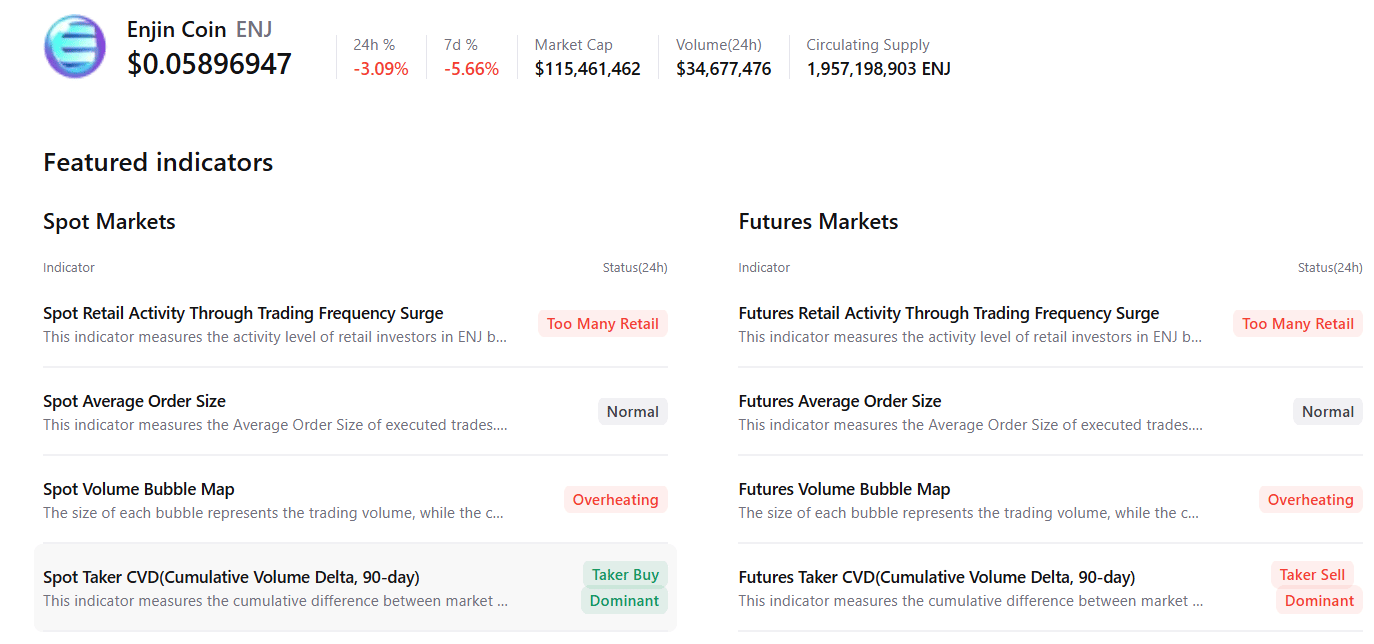
Enjin Coin’s price surged sharply in early April and is now taking a breather after posting massive gains. This pause in momentum suggests bullish exhaustion following the strong rally. CryptoQuant’s summary data also shows signs of buyer fatigue, with spot and futures markets suggesting rising retail activity, overheating, and increased sell-side dominance. These factors support a bearish near-term outlook for ENJ.
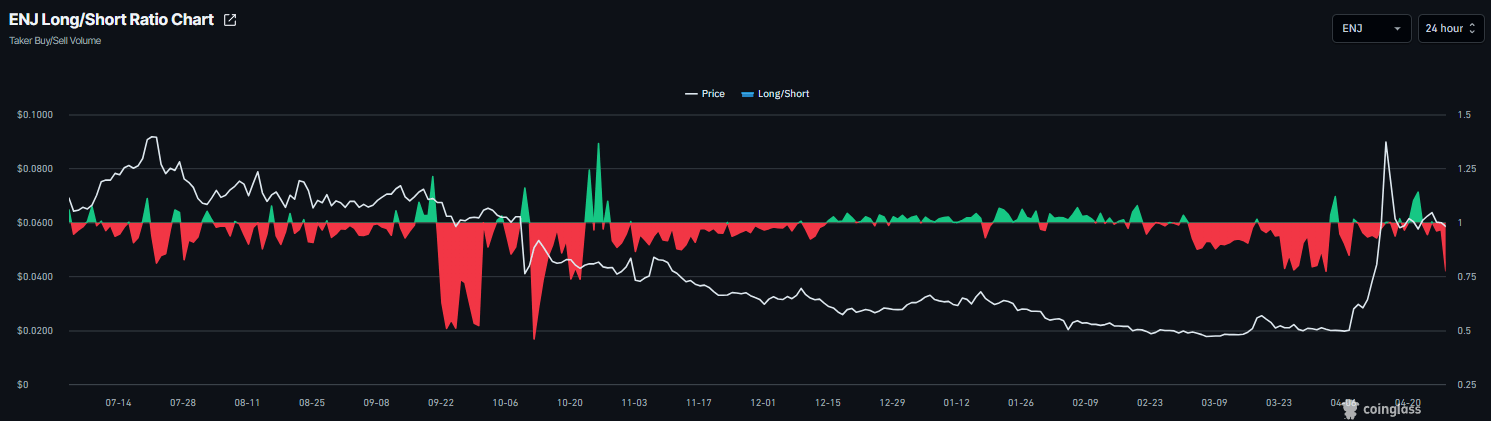
On the derivatives side, rising short bets among traders also support a negative outlook. CoinGlass' long-to-short ratio for ENJ reads 0.77 on Tuesday, nearing its lowest level in over a month. The ratio below one suggests more traders are betting the asset’s price will fall.
Enjin Coin Price Forecast: Early signs of weakness
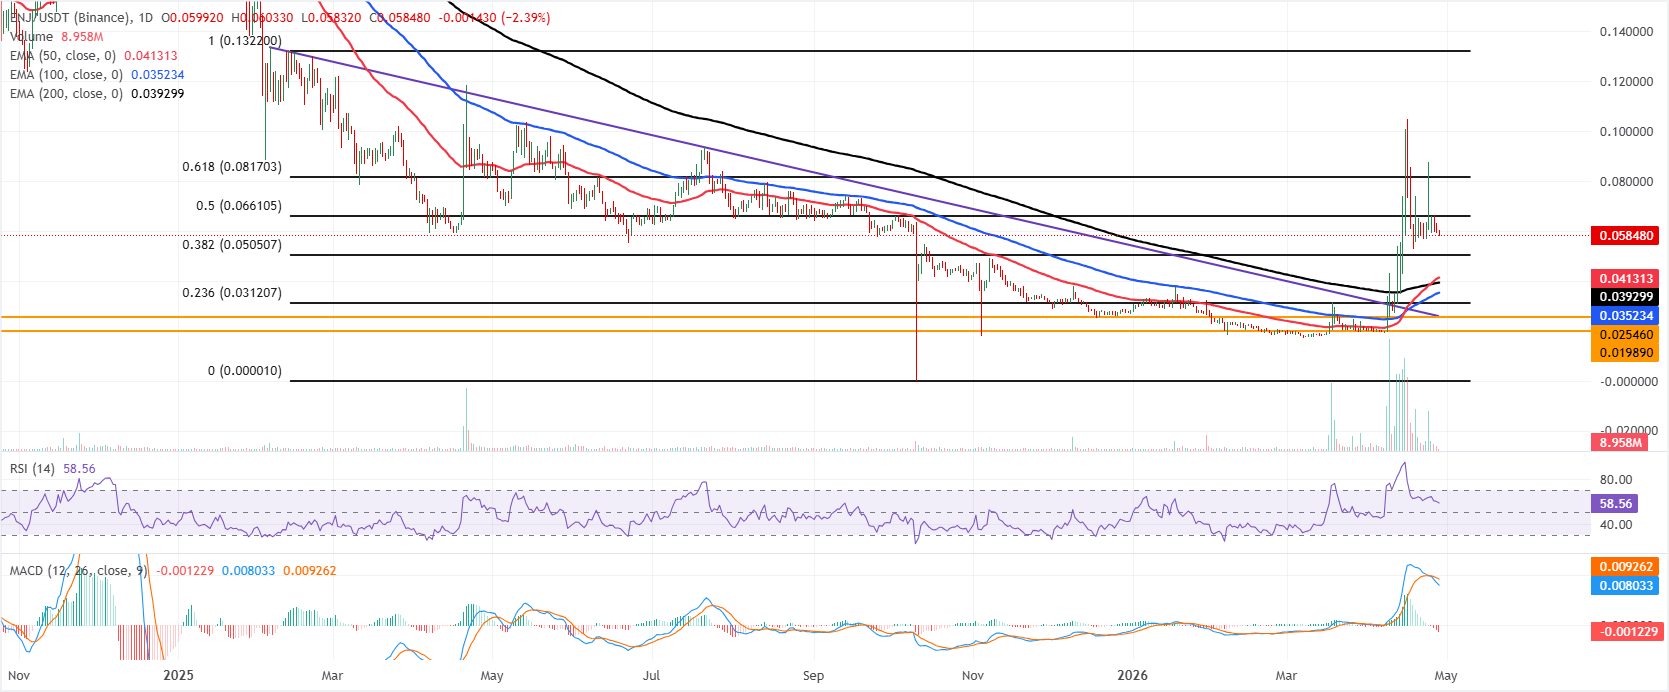
Enjin Coin is trading below $0.059 on Tuesday, following a slight correction over the previous two days. However, ENJ holds a constructive long-term bias as price consolidates well above the 50-day, 100-day, and 200-day Exponential Moving Averages (EMAs), clustered between roughly $0.040, suggesting an emerging base after the sharp rebound from sub-$0.030 levels.
The Relative Strength Index (RSI) around 59 keeps bullish momentum intact but shy of overbought, while the negative Moving Average Convergence Divergence (MACD) below the zero line hints that upside traction is moderating and rallies could face increasing scrutiny.
On the downside, initial support appears at the 38.2% Fibonacci retracement of the latest downswing near $0.050, reinforced by the 50-day EMA around $0.041 and deeper by the 100-day and 200-day EMAs at roughly $0.035 and $0.039, followed by structural cushions at the 23.6% retracement around $0.031 and the prior trendline break zone and horizontal floors between $0.025 and $0.019.
On the topside, immediate resistance is located at the 50% retracement at about $0.066, with further barriers at the 61.8% level near $0.081 and the higher retracement caps at $0.132; a daily close above $0.066 would open the door for a broader recovery, while failure to clear this band would keep ENJ in a range-bound consolidation above its newly established support base.
(The technical analysis of this story was written with the help of an AI tool.)














