

GBP/JPY Price Forecast: Bulls eye breakout above 214.00-215.00 resistance
- GBP/JPY trades near two-month highs as the Yen remains under pressure.
- Elevated Oil prices pressure JPY, while GBP benefits from improved risk sentiment.
- Technically, GBP/JPY tests key resistance near 214.00-215.00 following a rebound from the 100-day SMA.
GBP/JPY edges higher on Friday, extending gains for a fifth straight day as the Japanese Yen (JPY) remains on the defensive against most of the major peers. Elevated Oil prices continue to weigh on the Yen, given Japan’s status as a major net importer.

Meanwhile, the British Pound, a cyclical currency, is drawing support from a modest improvement in risk sentiment as earlier concerns over the durability of the US-Iran ceasefire ease, with traders now looking ahead to upcoming negotiations in Pakistan over the weekend.
At the time of writing, the cross is trading around 214.12, its highest level since February 9. Apart from near-term price action, the wide interest rate differential between the UK and Japan remains a key driver supporting the cross.
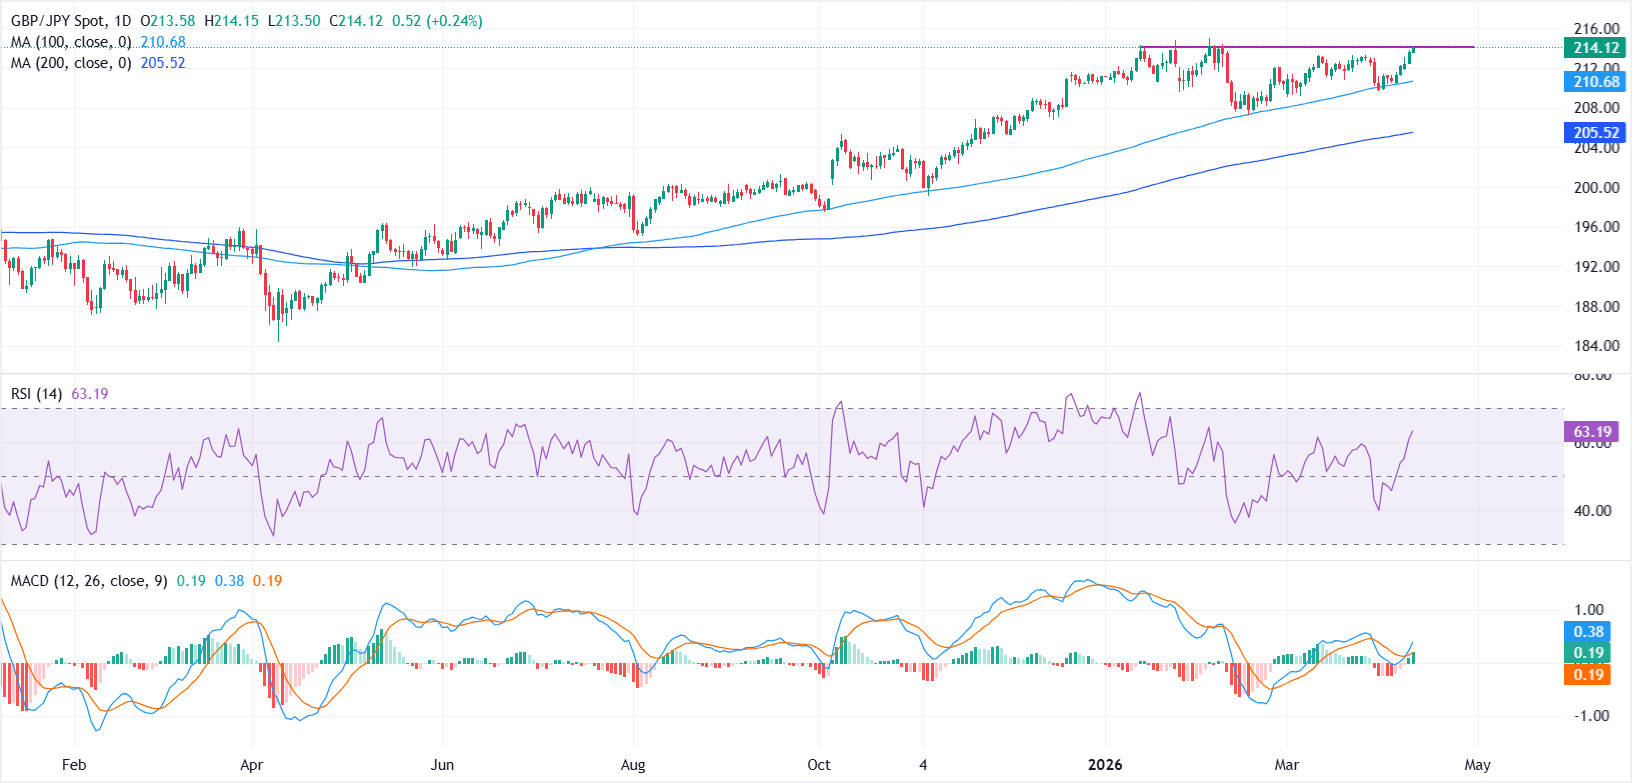
From a technical perspective, GBP/JPY maintains a bullish bias, with shallow pullbacks within a broader uptrend. The latest leg higher follows a rebound from the 100-day Simple Moving Average (SMA) at 210.68, which acts as reliable support and continues to cushion the downside.
Price is now testing the 214.00-215.00 zone, which has capped upside attempts since mid-January. A sustained break above this area would strengthen bullish momentum and open the door for further gains.
The Relative Strength Index (RSI) is near 63 points to strengthening bullish momentum without yet signaling overbought conditions. Meanwhile, the Moving Average Convergence Divergence (MACD) has turned positive again, suggesting that upside momentum is rebuilding after the recent consolidation phase.
On the downside, initial support is reinforced by the 100-day SMA at 210.68, which serves as the first line of defense should GBP/JPY correct lower. A deeper pullback would likely look toward the 200-day SMA at 205.52 as a more substantial structural floor, where longer-term buyers could re-emerge to protect the broader uptrend.
Japanese Yen Price Today
The table below shows the percentage change of Japanese Yen (JPY) against listed major currencies today. Japanese Yen was the strongest against the Australian Dollar.
| USD | EUR | GBP | JPY | CAD | AUD | NZD | CHF | |
|---|---|---|---|---|---|---|---|---|
| USD | -0.14% | -0.15% | 0.08% | 0.08% | 0.09% | 0.13% | -0.24% | |
| EUR | 0.14% | -0.01% | 0.24% | 0.23% | 0.23% | 0.28% | -0.11% | |
| GBP | 0.15% | 0.00% | 0.26% | 0.25% | 0.23% | 0.29% | -0.11% | |
| JPY | -0.08% | -0.24% | -0.26% | -0.03% | 0.01% | 0.00% | -0.37% | |
| CAD | -0.08% | -0.23% | -0.25% | 0.03% | 0.01% | 0.06% | -0.33% | |
| AUD | -0.09% | -0.23% | -0.23% | -0.01% | -0.01% | 0.04% | -0.34% | |
| NZD | -0.13% | -0.28% | -0.29% | -0.01% | -0.06% | -0.04% | -0.39% | |
| CHF | 0.24% | 0.11% | 0.11% | 0.37% | 0.33% | 0.34% | 0.39% |
The heat map shows percentage changes of major currencies against each other. The base currency is picked from the left column, while the quote currency is picked from the top row. For example, if you pick the Japanese Yen from the left column and move along the horizontal line to the US Dollar, the percentage change displayed in the box will represent JPY (base)/USD (quote).














