
Key Takeaways:
2) Combining economic, industry, and company analysis builds a layered view that improves valuation accuracy and decision quality.
a) Tracking interest rates, inflation, and growth links macro conditions to sector earnings and valuation multiples.
b) Assessing growth, competition, and cyclicality shows how sector trends amplify or dampen a firm’s profits.
c) Reading financials and management quality translates business performance into the durability of cash flows and risk.
3) Using both qualitative and quantitative lenses reduces blind spots and yields a fuller picture of future prospects.
a) Leadership execution, brand strength, and business model resilience signal staying power that raw numbers can miss.
b) Ratios and trends in revenue, margins, ROE, ROA, EPS, and P E quantify efficiency, profitability, and potential mispricing.
4) Top down and bottom up are complementary paths to identifying high quality, reasonably priced opportunities.
a) Starting from the economy then narrowing to strong sectors and stocks aligns selections with prevailing macro forces.
b) Focusing on firm level advantages and financials surfaces companies that can outperform regardless of the cycle.
5) The approach is time intensive, requires accounting and economic skill, and suits longer horizons, so many traders pair it with technical tools for timing.
How Fundamental Analysis Works
At its core, fundamental analysis of stocks helps traders determine whether a stock’s intrinsic value is higher or lower than its current market value. If the analysis reveals that the intrinsic value exceeds the market price, the stock is considered undervalued, signaling a buying opportunity.
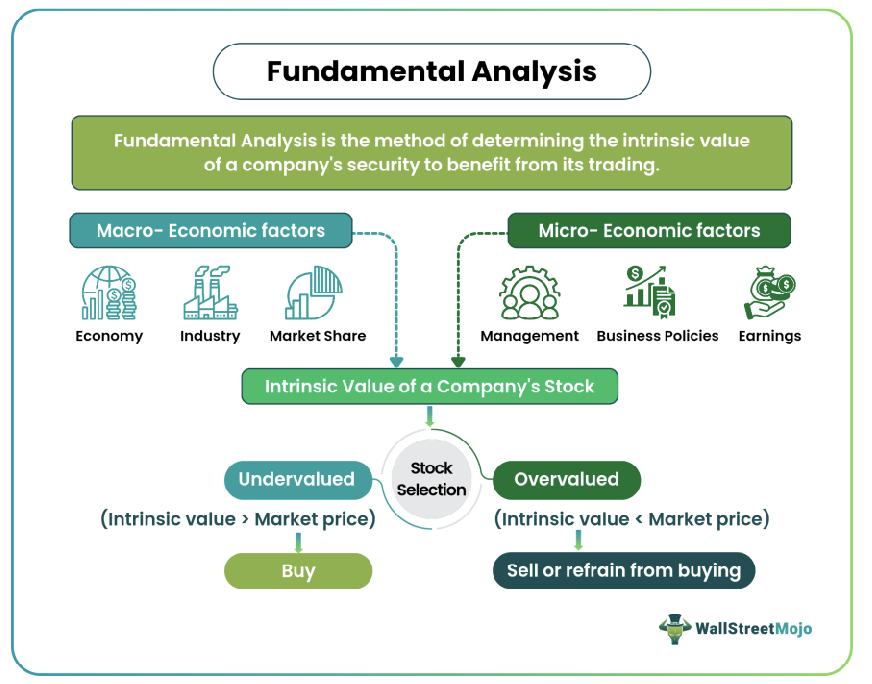
Source: Wall Street Mojo
In contrast, if a stock’s intrinsic value is lower than the market price, it is considered overvalued, and traders may avoid buying it. The goal of fundamental analysis is to enable traders to profit by identifying these discrepancies between intrinsic value and market value.
This analysis thoroughly examines a company’s financial statements, including its balance sheets, income statements, and cash flow reports. It also involves considering the broader economic and industry context, which helps traders better understand the stock. In practice, this often complements product knowledge such as share CFDs and the range of markets available to trade.
Key Components of Fundamental Analysis
Fundamental analysis can be broken down into three major components: economic analysis, industry analysis, and company analysis. Each component provides valuable insights into different aspects of a stock or investment, making it crucial for traders to master them all.
Economic Analysis. This involves studying macroeconomic factors such as interest rates, inflation, and GDP. Economic calendars help traders track releases that can move markets and affect valuations. For example, rising interest rates may hurt sectors that rely on borrowing, such as real estate or utilities.
Industry Analysis: Industry analysis focuses on understanding the specific industry in which a company operates. It looks at industry growth, sector performance, and competitive forces. Industry trends can greatly influence a company's profitability and future growth prospects. For instance, a booming technology sector may boost companies like Apple and Microsoft, while a sluggish retail sector could negatively impact traditional retailers.
Company Analysis: This is where traders delve into a company's internal performance metrics. Financial statements, management quality, business models, and company branding are evaluated to assess the stock’s long-term potential. It’s not just about looking at the numbers but also understanding how well the company is managed and perceived in the marketplace.
Together, these three components provide traders with a comprehensive picture, helping them decide whether a particular stock is worth buying, holding, or selling.
Types of Fundamental Analysis
When conducting fundamental analysis, traders use both qualitative and quantitative approaches. Each approach provides a different perspective on the stock and helps form a more complete analysis.
Source: Wall Street Mojo
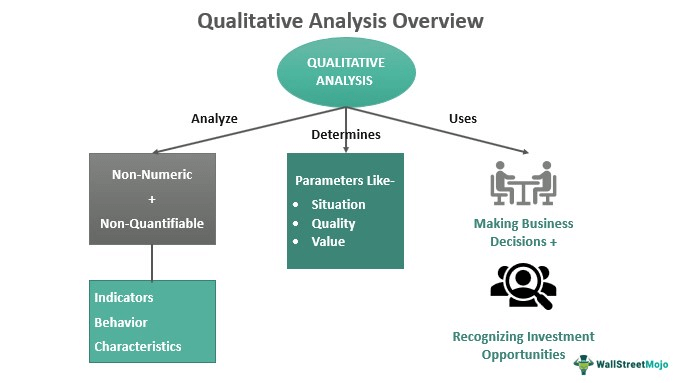
1. Qualitative Analysis
Qualitative analysis focuses on non-numerical factors that can affect a company’s performance. These include elements like management quality, brand strength, and business models.
Factors such as how well a company’s leadership executes its vision and its reputation in the market can be difficult to quantify. Yet, they are often crucial indicators of a company’s long-term viability.
For example, a company with a strong brand and a loyal customer base may weather economic downturns better than a weaker market presence. In addition, leadership changes or shifts in consumer preferences can dramatically affect the company’s stock price.
1Source: Wall Street Mojo
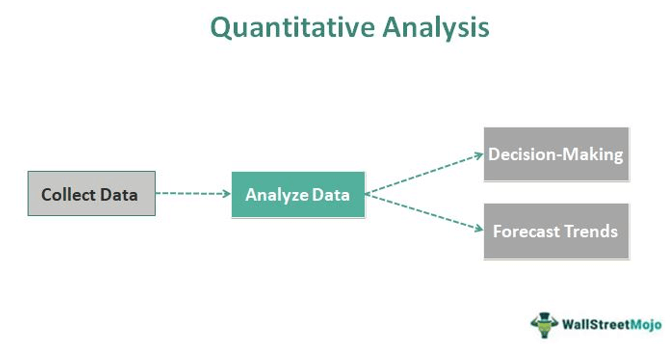
2. Quantitative Analysis
Quantitative analysis, on the other hand, deals with hard data. This includes financial reports, historical performance metrics, and statistical data.
Analysts gauge a company’s health by examining its quarterly earnings, revenue growth, profit margins, and other financial ratios. This analysis allows traders to assess a company’s ability to generate profits, manage debt, and maintain strong cash flow.
One popular method in quantitative analysis is to use the price-to-earnings (P/E) ratio to determine whether a stock is undervalued or overvalued. Other important metrics include return on equity (ROE), return on assets (ROA), and earnings per share (EPS).
These figures provide insights into how well a company uses its resources to generate shareholder returns.
Approaches to Conducting Fundamental Analysis
There are two main approaches to conducting fundamental analysis: the top-down approach and the bottom-up approach.
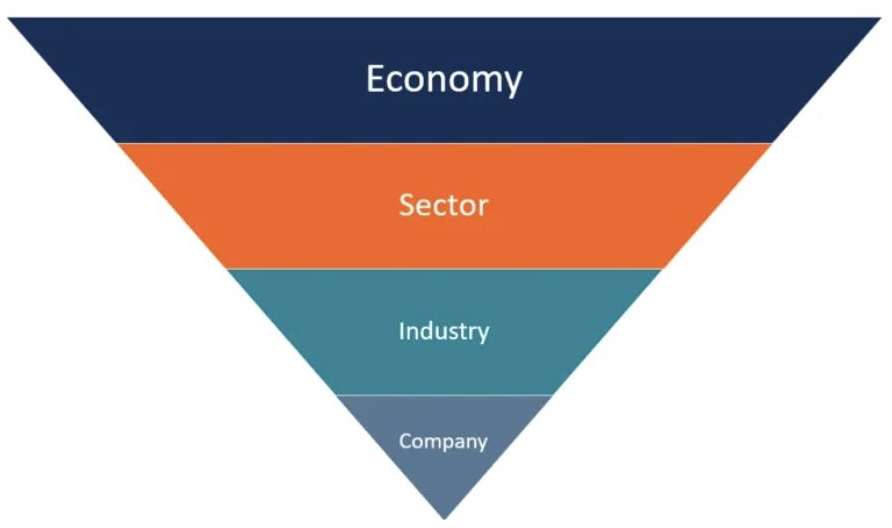
Source: CFI
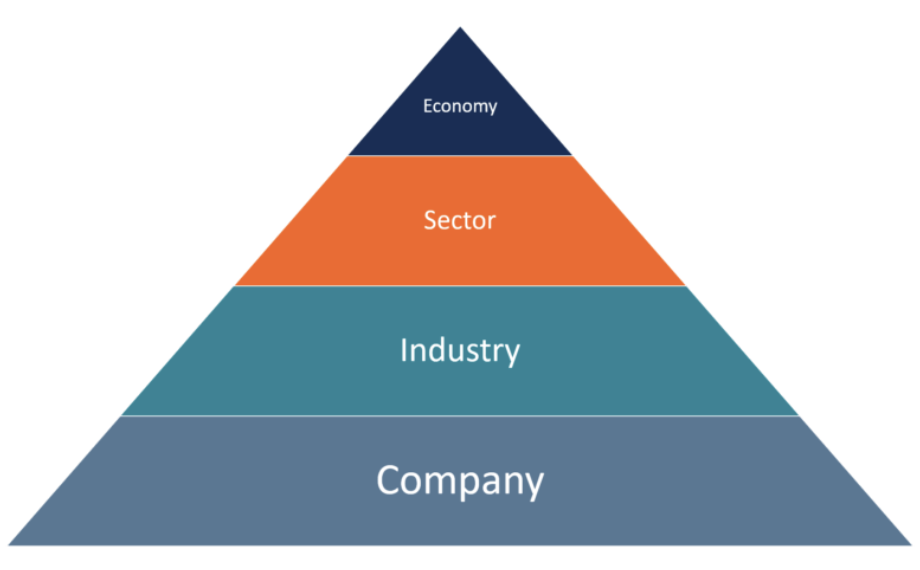
Top-Down Approach
In the top-down approach, traders begin by analyzing the broader economy. They look at macroeconomic indicators like inflation rates, unemployment rates, and GDP growth to assess the overall health of the economy. Top-down analysis then narrows to sectors and finally to stocks that show relative strength.
Once they understand the economic landscape, they narrow their analysis to specific sectors or industries that show promise. Finally, they focus on individual stocks within those sectors that have the potential to outperform.
Investors who believe broader economic trends will influence individual stock performance often use this approach.
Source: CFI
Bottom-Up Approach
Conversely, the bottom-up approach starts by analyzing individual companies. Traders using this method focus on a company's specific performance without emphasising the overall industry or economy.
The belief here is that certain companies can outperform their industry or the economy, even during periods of economic downturn.
Bottom-up investors prioritize microeconomic factors, such as a company’s product lineup, competitive advantages, and financial metrics, to make investment decisions.
Limitations of Fundamental Analysis
While fundamental analysis is an invaluable tool for making long-term investment decisions, it has limitations. One key challenge is that it is time-consuming.
Conducting a thorough fundamental analysis requires deep knowledge of both accounting and economics, as well as the ability to interpret financial statements accurately.
Additionally, fundamental analysis is primarily focused on the long term, which may not be ideal for traders looking to profit from short-term price movements. Combining fundamental analysis with technical analysis can provide a more well-rounded trading strategy. For chart-based signals, traders often use tools such as RSI, MACD, trend lines, and price charts.
Fundamental analysis remains one of the most reliable ways for traders to uncover undervalued or overvalued securities, allowing them to make informed trading decisions.
Traders can gain insights into a stock's true value by studying the economic landscape, industry trends, and a company's financial health. Whether using a top-down or bottom-up approach, market analysis tools can support a consistent process and help mitigate risks and optimize returns in the financial markets.


