

AUD/USD Price Forecast: On verge of Head and Shoulder breakdown
- AUD/USD tumbles to near 0.7100 as the Australian Dollar underperforms due to multiple headwinds.
- The exchange of attacks between the US and Iran has dented optimism towards a peace deal.
- Slower-than-projected Australian CPI growth in April has forced traders to pare hawkish RBA bets.
The Australian Dollar (AUD) slumps over 0.5% to near 0.7100 during the Asian trading session on Thursday. The Aussie par slumps as the antipodean underperforms its peers due to risk-off market sentiment and diminished hawkish Reserve Bank of Australia (RBA) bets.

Australian Dollar Price Today
The table below shows the percentage change of Australian Dollar (AUD) against listed major currencies today. Australian Dollar was the weakest against the US Dollar.
| USD | EUR | GBP | JPY | CAD | AUD | NZD | CHF | |
|---|---|---|---|---|---|---|---|---|
| USD | 0.30% | 0.38% | 0.05% | 0.16% | 0.55% | 0.51% | 0.32% | |
| EUR | -0.30% | 0.08% | -0.28% | -0.15% | 0.25% | 0.22% | 0.02% | |
| GBP | -0.38% | -0.08% | -0.34% | -0.23% | 0.17% | 0.15% | -0.07% | |
| JPY | -0.05% | 0.28% | 0.34% | 0.11% | 0.51% | 0.46% | 0.28% | |
| CAD | -0.16% | 0.15% | 0.23% | -0.11% | 0.41% | 0.36% | 0.16% | |
| AUD | -0.55% | -0.25% | -0.17% | -0.51% | -0.41% | -0.02% | -0.24% | |
| NZD | -0.51% | -0.22% | -0.15% | -0.46% | -0.36% | 0.02% | -0.21% | |
| CHF | -0.32% | -0.02% | 0.07% | -0.28% | -0.16% | 0.24% | 0.21% |
The heat map shows percentage changes of major currencies against each other. The base currency is picked from the left column, while the quote currency is picked from the top row. For example, if you pick the Australian Dollar from the left column and move along the horizontal line to the US Dollar, the percentage change displayed in the box will represent AUD (base)/USD (quote).
Market sentiment turns favorable for safe-haven assets as Iran has retaliated against the United States (US) attacks near Bandar Abbas airport by striking its military bases in the Gulf region. At press time, the US Dollar Index (DXY), which tracks the Greenback’s value against six major currencies, trades 0.3% higher, slightly above 99.50. S&P 500 futures and all major Asian stock markets are bleeding, as of writing, indicating a significant dent in investors’ risk appetite.
Hawkish RBA prospects have squeezed as the Australian Consumer Price Index (CPI) data for April showed that inflationary pressures cooled down at a faster-than-expected pace. Month-on-month CPI arrived at 0.4%, lower than 0.6% estimates and the previous reading of 1.1%. On an annualized basis, the Australian CPI grew at a moderate pace of 4.2% against expectations of 4.4% and the March reading of 4.6%.
Following the Australian CPI data, markets now imply almost no chance of a June move, while the probability of an August hike has more than halved to 40%, Reuters reports.
AUD/USD technical analysis
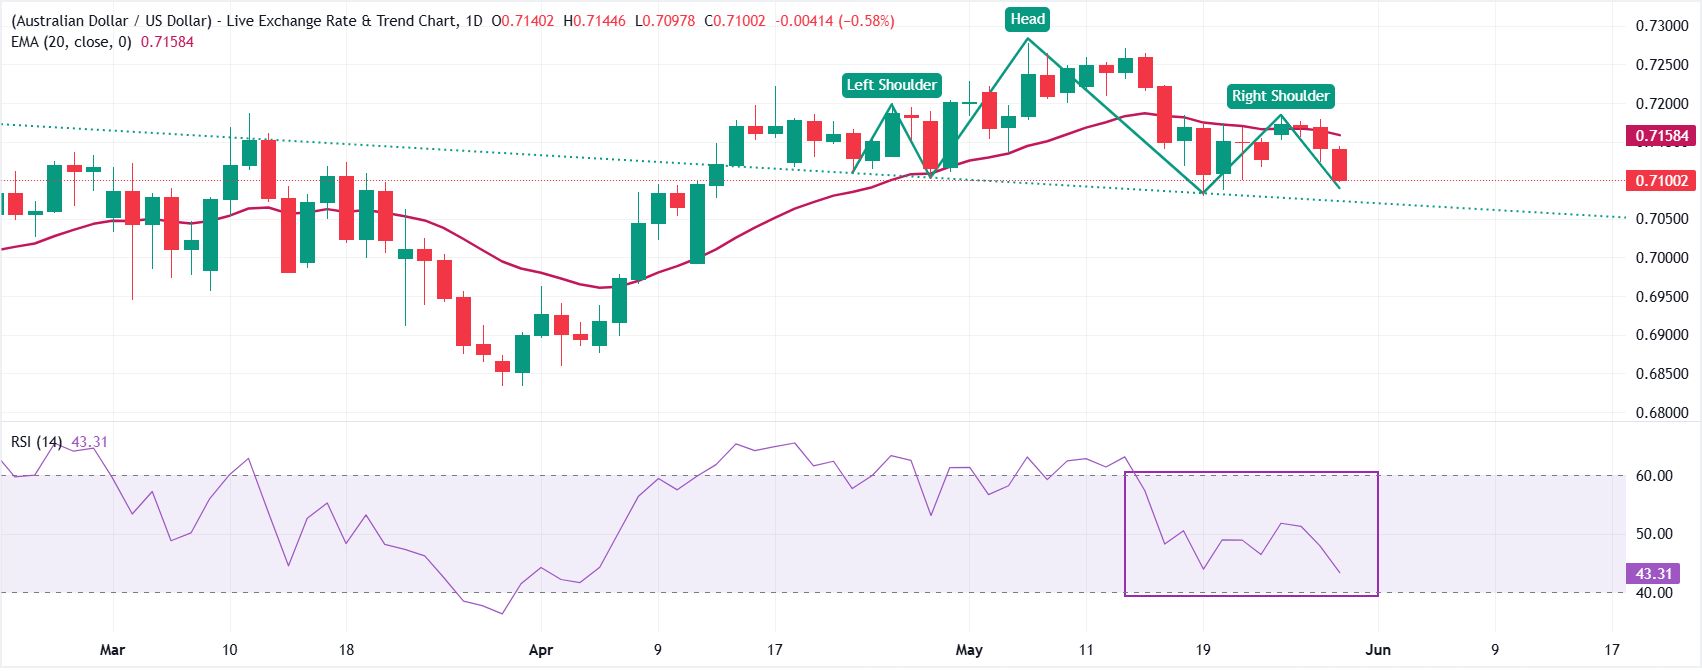
AUD/USD trades significantly lower at around 0.7100 as of writing. The near-term tone of the pair is bearish as it holds below the 20-period exponential moving average (EMA), which is at 0.7158. Also, the Head and Shoulder (H&S) formation backs a bearish bias.
The Relative Strength Index (RSI) is near 43, indicating subdued momentum rather than oversold conditions, hinting that sellers still retain the upper hand.
Looking down, the pair could enter a fresh leg of decline if it breaks below the neckline of the H&S formation at around 0.7070. Major support zones will be 0.7050 and the April 13 low around 0.6990. On the topside, the 20-day EMA at 0.7158 is the first resistance to beat for the bulls to ease immediate downside pressure and open the way for a more sustained recovery towards 0.7200.
(The technical analysis of this story was written with the help of an AI tool.)
Economic Indicator
Consumer Price Index (YoY)
The Consumer Price Index (CPI), released by the Australian Bureau of Statistics on a monthly basis, measures the changes in the price of a comprehensive basket of goods and services acquired by household consumers. The indicator is the primary measure of headline inflation after a new methodology was applied to transition from quarterly to monthly readings, applying to data from April 2024 onwards. The YoY reading compares prices in the reference month to the same month a year earlier. A high reading is seen as bullish for the Australian Dollar (AUD), while a low reading is seen as bearish.
Read more.Last release: Wed May 27, 2026 01:30
Frequency: Monthly
Actual: 4.2%
Consensus: 4.4%
Previous: 4.6%
Source: Australian Bureau of Statistics














