

Bonk Price Forecast: BONK $0.000004 breakout in focus as technicals improve
- Bonk extends gains toward $0.0000040 resistance, aligning with the broader crypto market recovery.
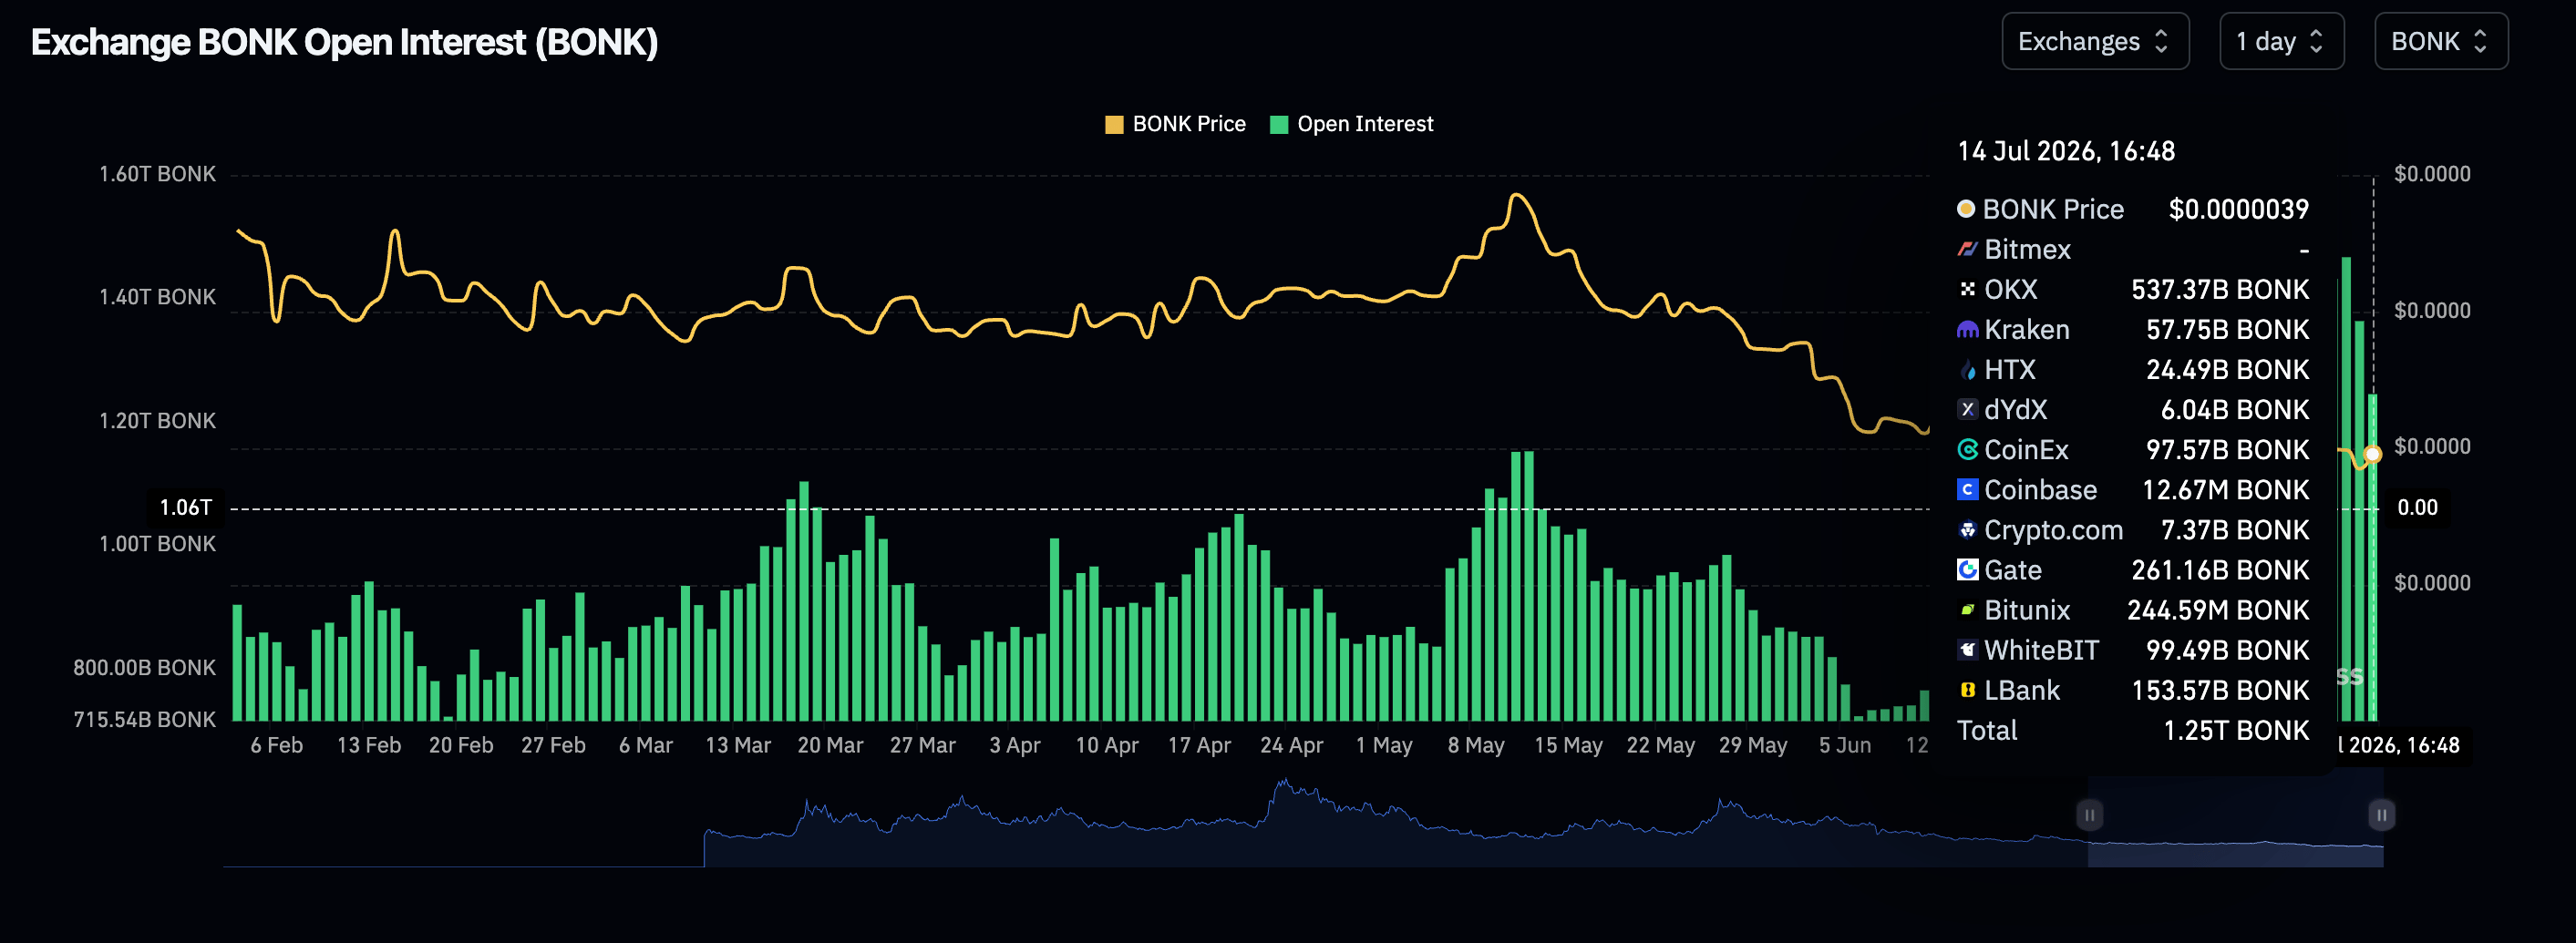
- Bonk’s derivatives market remains weak with perpetual futures Open Interest dropping to 1.25 trillion BONK.
- Bonk builds momentum, supported by a MACD buy signal, but declining moving averages cap the upside.
Bonk (BONK) is gaining momentum, trading around $0.0000039 at the time of writing on Tuesday. The Bureau of Labor Statistics (BLS) reported that the Consumer Price Index (CPI) declined by 0.4% in June on a seasonally-adjusted basis, marking the sharpest monthly decrease since April 2020.

This pullback brought the annual headline inflation rate down to 3.5% from 4.2% in May, a notable cooling that could influence risk sentiment and speculative flows in risk assets.
Core inflation, which excludes the more volatile food and energy prices, remained flat MoM, keeping the annual rate steady at 2.6%, down from 2.9% in May.
BONK derivatives activity cools
Retail demand for Bonk derivatives has cooled further with perpetual futures Open Interest (OI) averaging 1.25 trillion BONK on Tuesday, down from 1.36 trillion BONK the previous day. Looking back, OI averaged 1.48 trillion BONK on Saturday, suggesting a shift in the short-term outlook among retail investors. If sustained, the cooling OI could lag the current rebound.
Price analysis: Bonk bulls tighten grip
Bonk moves toward a potential breakout above the next resistance level at $0.0000040, with support from an improving technical structure. The Moving Average Convergence Divergence (MACD) indicator has confirmed a buy signal on the 4-hour chart, with its histogram expanding marginally within the positive region, reinforcing the short-term gains.
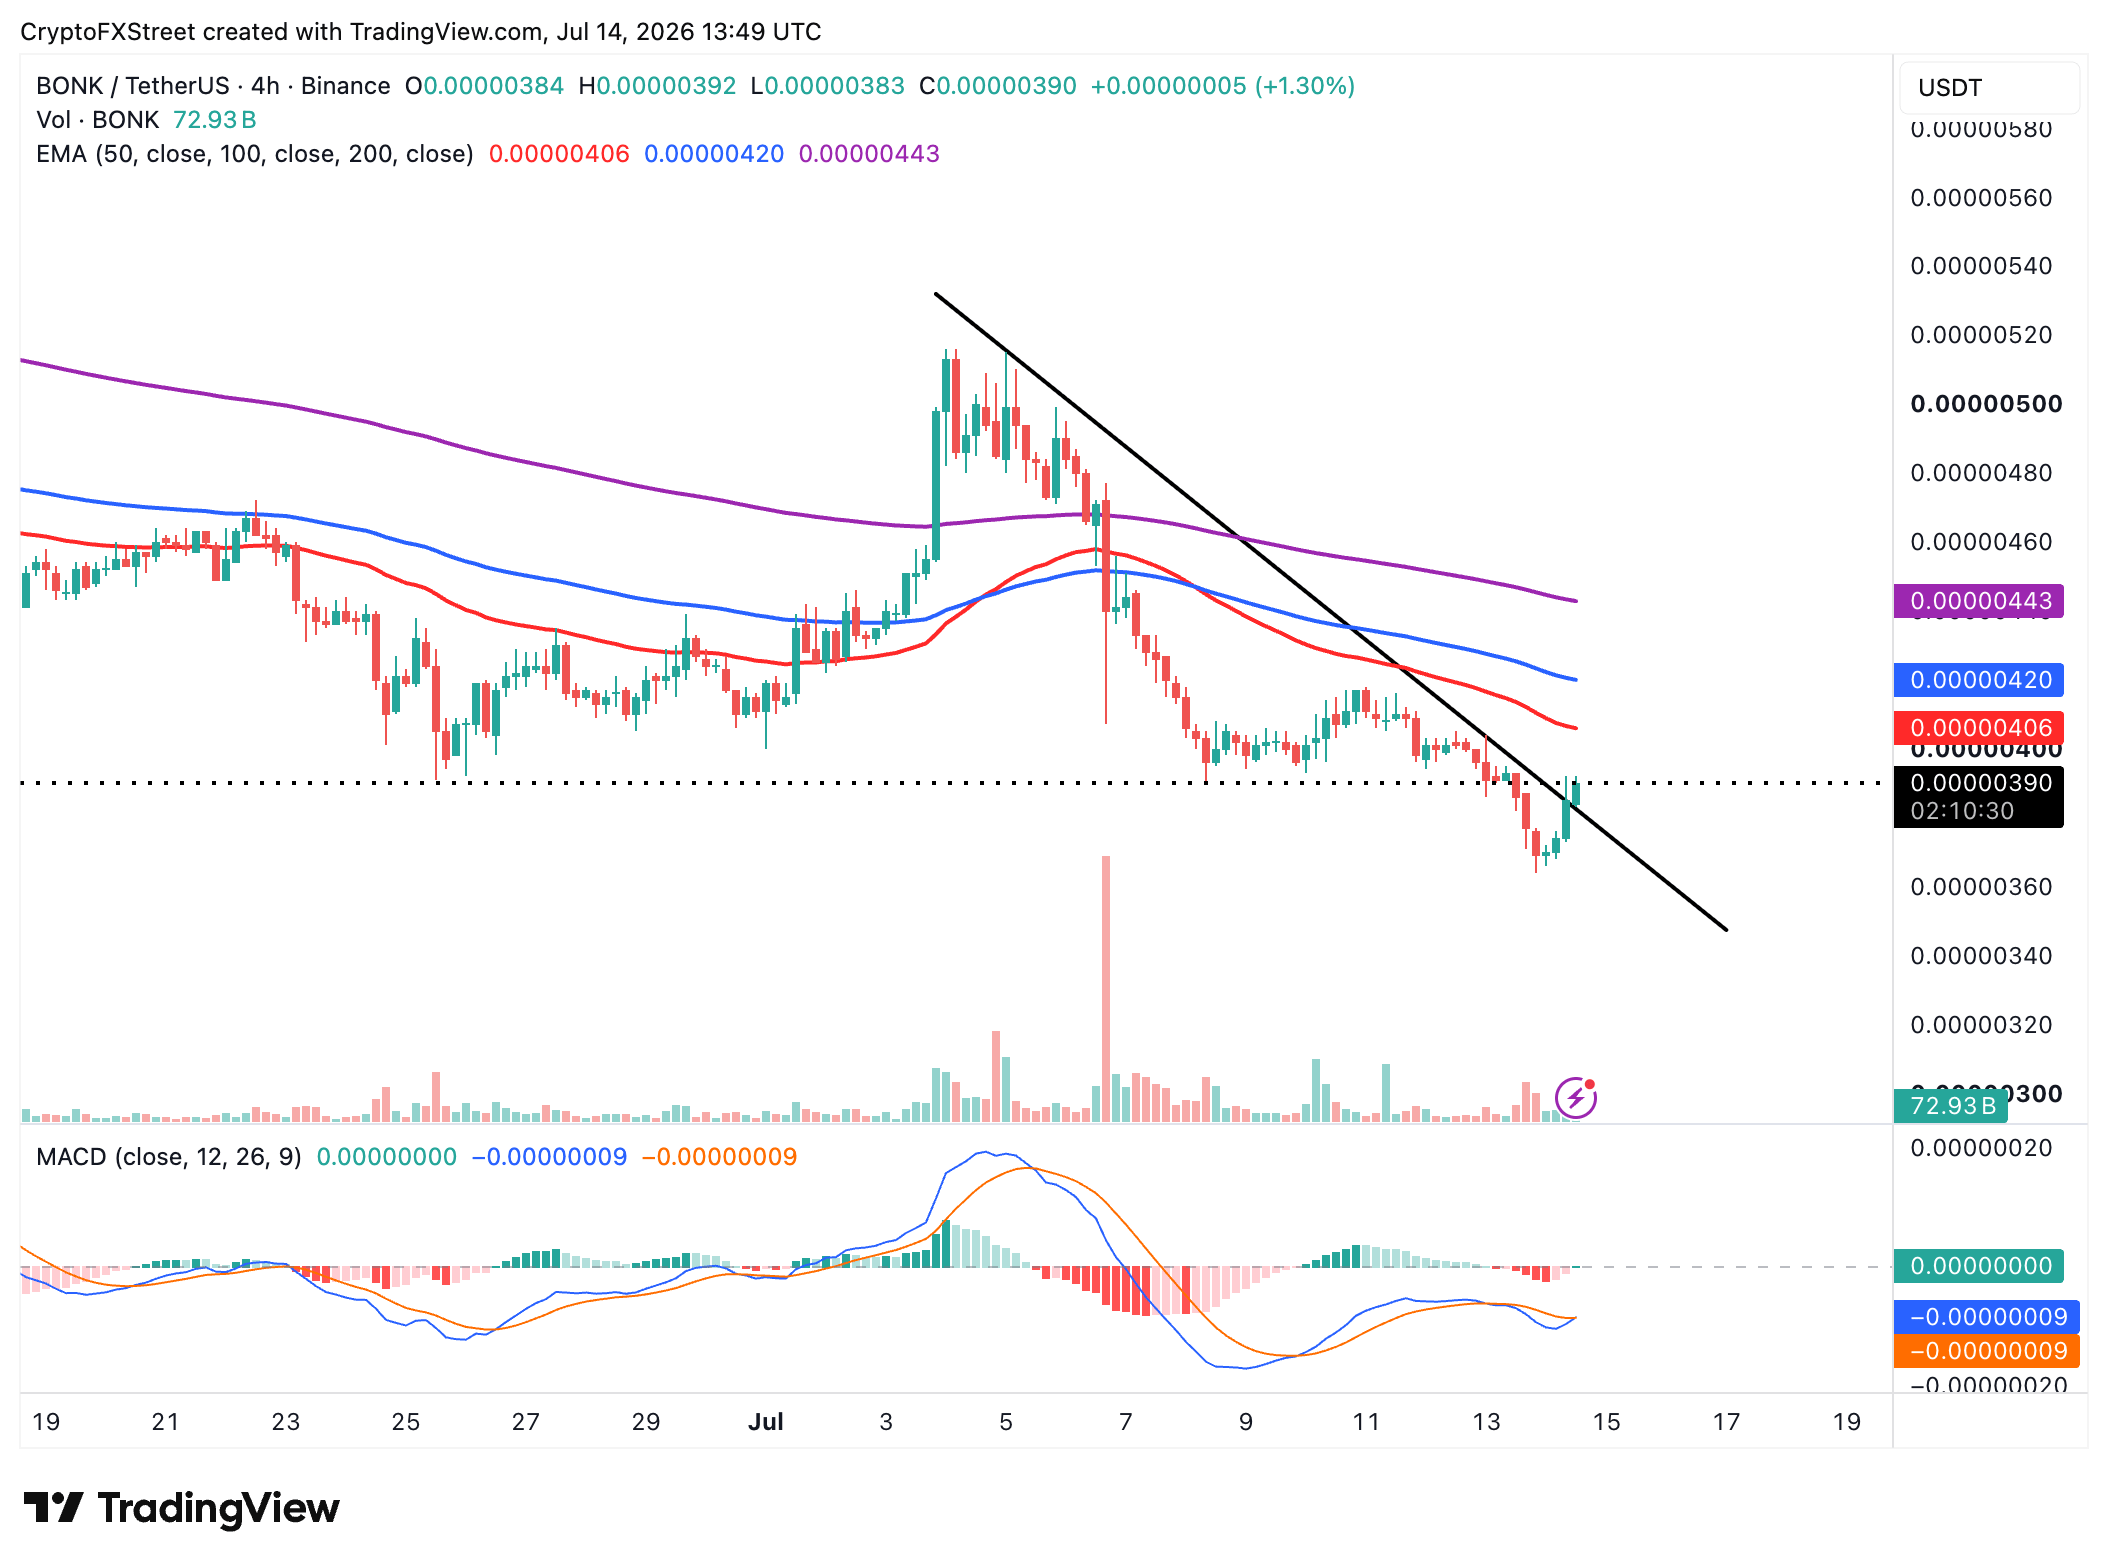
A daily close above $0.000004 is needed to steady the recovery within a broader bearish outlook. Further up, the 50-candle Exponential Moving Average (EMA) near $0.0000041 highlights a resistance level, where sellers could reassert their influence, followed by the 100-candle EMA at $0.0000042 and the 200-candle EMA at $0.0000044.
On the flip side, immediate support emerges at the descending trendline’s break area around $0.00000384 and then Monday’s low at $0.0000036.
Open Interest, funding rate FAQs
Higher Open Interest is associated with higher liquidity and new capital inflow to the market. This is considered the equivalent of increase in efficiency and the ongoing trend continues. When Open Interest decreases, it is considered a sign of liquidation in the market, investors are leaving and the overall demand for an asset is on a decline, fueling a bearish sentiment among investors.
Funding fees bridge the difference between spot prices and prices of futures contracts of an asset by increasing liquidation risks faced by traders. A consistently high and positive funding rate implies there is a bullish sentiment among market participants and there is an expectation of a price hike. A consistently negative funding rate for an asset implies a bearish sentiment, indicating that traders expect the cryptocurrency’s price to fall and a bearish trend reversal is likely to occur.














