
British Pound slips as war-driven PPI fuels US Dollar rebound
Bởi Christian Borjon Valencia
Đã cập nhật: 11 Jun 2026


BÀI VIẾT PHỔ BIẾN

The Pound Sterling registers losses of 0.19% on Thursday after the latest US inflation report reflected the impact of the Iran war on energy prices, while an escalation of hostilities between Washington and Tehran triggered a recovery in oil prices.
- US PPI tops forecasts as energy costs drive price pressures.
- Trump’s Iran threats lift geopolitical risk and oil volatility.
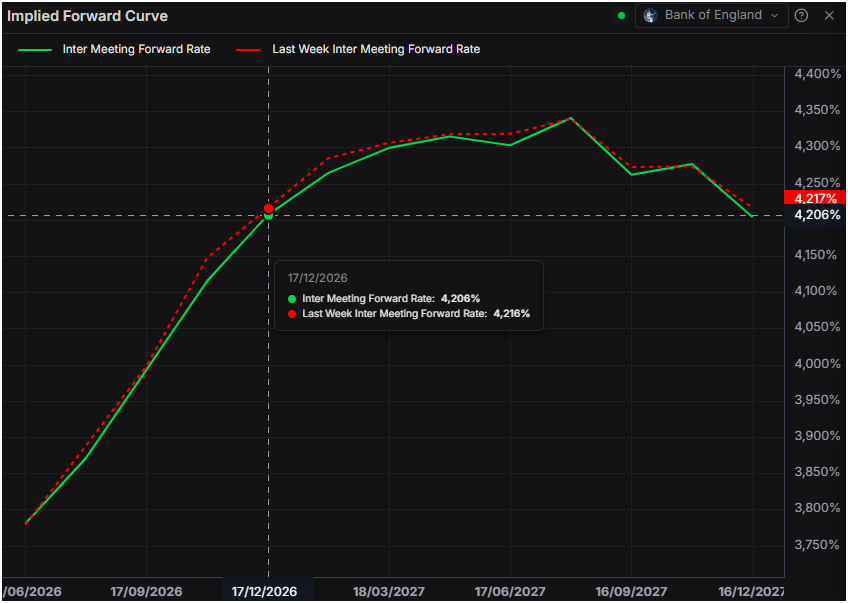
- BoE hike bets cushion Sterling before UK GDP figures.
The Pound Sterling registers losses of 0.19% on Thursday after the latest US inflation report reflected the impact of the Iran war on energy prices, while an escalation of hostilities between Washington and Tehran triggered a recovery in oil prices. The GBP/USD trades at 1.3330 after peaking at 1.3391.
GBP/USD weakens as energy-led inflation revives Greenback demand
The Middle East conflict rattled the financial markets. Comments of US President Donald Trump saying that he will hit Iran “hard” and that he considers taking Kharg Island, he said to Fox News. In the meantime, Tehran attacks US bases and is considering targeting Elon Musk’s companies, according to FARS news agency.
Data from the US revealed that the Producer Price Index (PPI) rose by 6.5% YoY in May, exceeding the prior month’s 5.7% and estimates of 6.4%. Digging into the report, nearly 80% of the price surge is due to energy products. Core PPI, which excludes volatile items, rose by 4.9% YoY for the same period, below the consensus of 5.4% and unchanged compared to April’s.
Jobless claims for the week ending on June 6 rose by 229K, exceeding the 219K expected by analysts.
The US Dollar Index (DXY), which tracks the Greenback’s value against a basket of currencies, is up 0.10% at 100.18, boosted by the recovery of Oil prices. WTI, the US crude Oil benchmark, has trimmed some of its earlier losses after hitting a low of $88.63, trading near $90.36, down 1.50%.
In the UK, traders are eyeing the release of Gross Domestic Product (GDP) figures on Friday. The Pound Sterling has been supported by expectations of interest rate hikes by the Bank of England (BoE), with the swaps market pricing in 46 basis points of tightening by the bank, led by Governor Andrew Bailey and Co according to Prime Terminal.
The US economic schedule will feature the University of Michigan Consumer Sentiment survey, expected to improve from 44.8 to 46 in June’s preliminary reading.
GBP/USD Price Forecast: Technical outlook
In the daily chart, GBP/USD trades at 1.3341 with a bearish near‑term bias, holding beneath the cluster of simple moving averages around 1.3463 and below the reclaimed break point of the former rising trend line at 1.3411. The Relative Strength Index (14) around 40 points to soft momentum, suggesting sellers retain control while price remains capped under the descending resistance structure drawn from 1.3869, whose break level near 1.3564 now reinforces the overhead supply zone.
On the topside, initial resistance emerges at the broken rising trend‑line area around 1.3411, followed by the grouped simple moving averages near 1.3463, with the former downtrend break at 1.3564 and the 1.3869 origin of that line acting as higher resistance levels. On the downside, the main structural support is traced back to the origin of the current ascending trend line near 1.3159, where buyers would be expected to show more robust interest if the pair extends its decline.
(The technical analysis of this story was written with the help of an AI tool.)
Pound Sterling Price Today
The table below shows the percentage change of British Pound (GBP) against listed major currencies today. British Pound was the strongest against the Canadian Dollar.
| USD | EUR | GBP | JPY | CAD | AUD | NZD | CHF | |
|---|---|---|---|---|---|---|---|---|
| USD | 0.12% | 0.21% | -0.05% | 0.44% | 0.15% | 0.24% | 0.00% | |
| EUR | -0.12% | 0.09% | -0.17% | 0.32% | -0.07% | 0.14% | -0.11% | |
| GBP | -0.21% | -0.09% | -0.26% | 0.23% | -0.14% | 0.05% | -0.20% | |
| JPY | 0.05% | 0.17% | 0.26% | 0.48% | 0.09% | 0.29% | 0.06% | |
| CAD | -0.44% | -0.32% | -0.23% | -0.48% | -0.38% | -0.16% | -0.43% | |
| AUD | -0.15% | 0.07% | 0.14% | -0.09% | 0.38% | 0.21% | -0.07% | |
| NZD | -0.24% | -0.14% | -0.05% | -0.29% | 0.16% | -0.21% | -0.25% | |
| CHF | -0.01% | 0.11% | 0.20% | -0.06% | 0.43% | 0.07% | 0.25% |
The heat map shows percentage changes of major currencies against each other. The base currency is picked from the left column, while the quote currency is picked from the top row. For example, if you pick the British Pound from the left column and move along the horizontal line to the US Dollar, the percentage change displayed in the box will represent GBP (base)/USD (quote).

Hơn một triệu người dùng dựa vào FXStreet để có dữ liệu thị trường thời gian thực, công cụ biểu đồ, góc nhìn chuyên gia và tin tức Forex. Lịch kinh tế toàn diện và các hội thảo web giáo dục giúp nhà giao dịch luôn cập nhật và đưa ra quyết định có tính toán. FXStreet có khoảng 60 nhân sự, chia giữa trụ sở Barcelona và nhiều khu vực toàn cầu.
Đọc thêm


