
Dow Jones Industrial Average trails chip rebound while CPI lines up to spoil it
Bởi Joshua Gibson
Đã cập nhật: 8 Jun 2026


BÀI VIẾT PHỔ BIẾN

The Dow Jones Industrial Average (DJIA) sat almost unchanged into the European afternoon, futures drifting around the 50,750 area after an overnight session that climbed off a low close to 50,500 up toward the 51,000 line before rolling straight over.
- The Dow lagged the chip-driven rebound that lifted the S&P 500 and Nasdaq off Friday's rout.
- A weekend round of Iran-Israel strikes left the ceasefire functional but visibly fraying.
- Wednesday's CPI consensus points to acceleration, the inflation passthrough the bid keeps ignoring.
The Dow Jones Industrial Average (DJIA) sat almost unchanged into the European afternoon, futures drifting around the 50,750 area after an overnight session that climbed off a low close to 50,500 up toward the 51,000 line before rolling straight over. The cash session took its cue from the same playbook: the S&P 500 rallied roughly 0.7% and the Nasdaq jumped about 1.3% as chip stocks ripped back from Friday's selloff, while the Dow scraped together a 0.1% gain, the laggard once again. The bid is real, the asymmetry is familiar, and the heavy lifting under the broad indices has nothing to do with the Dow's components.
The chip-led bounce the Dow can't catch
Friday's rout was a chip story, full stop. The Nasdaq dropped 4.2%, its worst session since April 2025, the major semiconductor exchange-traded fund (ETF) fell roughly 10%, and Micron alone gave back 13% as the market took profits on the names that have powered the last leg of the bull market. Monday's reversal is the same story in reverse. Micron is back up nearly 10%, the semi ETF up about 7%, and Nvidia and Broadcom are dragging the Nasdaq higher alongside it. Almost none of that lands in the Dow, which carries no Micron, no Broadcom, and only modest chip exposure overall. The asymmetry has been cutting both ways for the blue chips lately, lagging the upside when chips run and holding up when chips crack. Useful for diversification. Less useful when the tape demands you keep up.
A ceasefire still cracking at the edges
The Iran-Israel ceasefire is still nominally in place, but the weekend put fresh scratches on it. Iran's parliament speaker accused Washington of breaching the agreement, citing the residual naval posture and unresolved aspects of the Lebanon file, and Iranian missiles followed on Sunday. Israel responded Monday with what it described as a large-scale strike on Iranian defense systems, and President Donald Trump took to social media to demand both sides "immediately stop" while announcing that an "immediate" follow-on ceasefire was being negotiated. Iran's foreign ministry later said its operations against Israel had ended, with the caveat that further Israeli activity in Lebanon would restart hostilities. Crude Oil is pricing it about right: West Texas Intermediate (WTI) is higher by more than 1%, hovering near $91 a barrel, off its session highs but nowhere near pre-war levels. The ceasefire is functional. It is not peace.
The valuation question the SpaceX float is about to ask
There is a separate event risk no one is talking about loudly enough: SpaceX's market debut on Friday. The deal lands as one of the largest initial public offerings (IPOs) in market history and as a real-time referendum on the AI-adjacent valuation complex underpinning the same chip names that just snapped back. Blockbuster IPOs have a long history of marking the top of risk-on cycles, and pricing one this size into a fraying ceasefire and an accelerating Consumer Price Index (CPI) is the kind of setup that looks fine right up until it does not.
Data preview: Wednesday is where the assumption gets tested
Equities can absorb a flat Dow and a wobbly truce so long as the inflation picture cooperates, and Wednesday is where that assumption gets stress-tested. The May CPI prints at 12:30 GMT, and the consensus is hot. Headline is set at 0.5% MoM and 4.2% YoY against April's 3.8%, with core at 0.3% MoM and 2.9% YoY against 2.8%. The annual rate accelerating to a fresh cycle high is exactly the inflation passthrough hinted at by last month's core Personal Consumption Expenditures Price Index (PCE) print, the Iran war's energy shock finally landing in the consumer basket the way Federal Reserve (Fed) speakers have been quietly warning about. A print at or above consensus validates the "no longer transitory" framing and reinforces the rate futures tilt toward a hike rather than a cut. Thursday's Producer Price Index (PPI) is expected at 0.7% MoM headline with core year-on-year still running above 5%, and Friday's University of Michigan (UoM) consumer sentiment release will deliver its updated 1-year inflation expectations, which were near 4.8% last month. There is no obvious release on the docket built to rescue the bullish read.
Trading framework
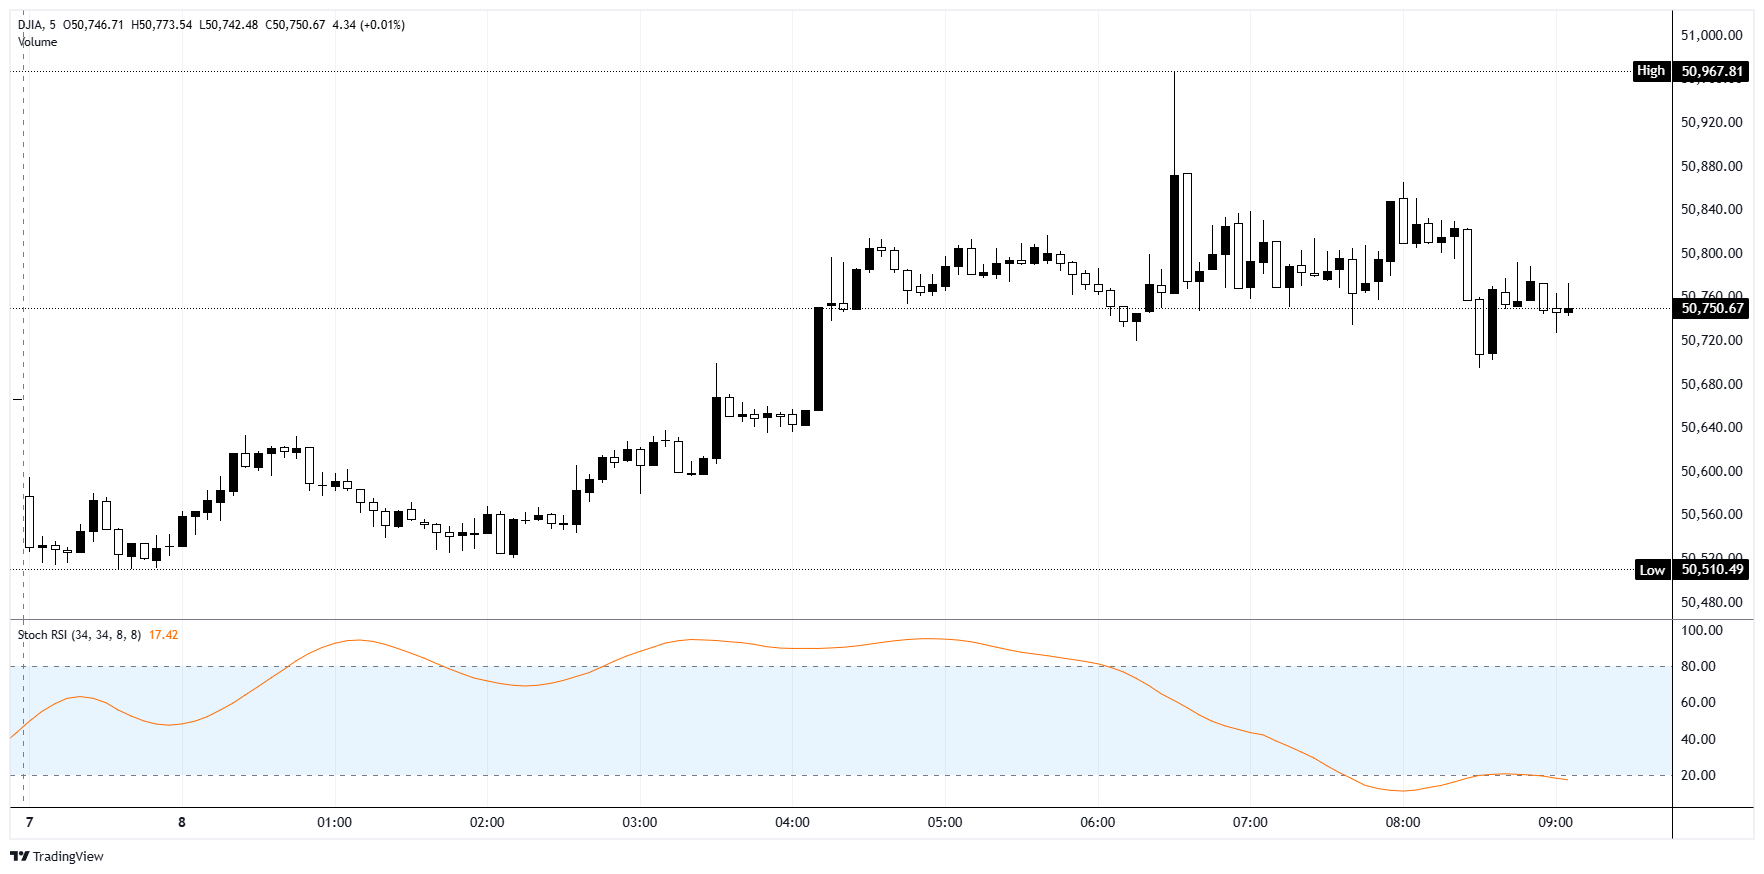
The daily trend is still up, with the 50-period Exponential Moving Average (EMA) well below current price and the 200 EMA further below still. The 5-minute tape, though, is the warning. The Stochastic Relative Strength Index (Stoch RSI) is buried near 18, the kind of reading that either snaps back hard or confirms the session is done.
Resistance is the 51,000 zone, last week's ceiling and today's intraday high just under it. A clean break needs Wednesday's CPI to come in soft, and the consensus does not allow for that. First support is 50,500, today's defended low, with 50,000 the deeper psychological magnet underneath. A close below 50,500 paired with a hot CPI puts 50,000 in play quickly, and from there the trend itself comes into question.
Bias leans cautiously bearish into Wednesday. The risk-on tape is built on a chip rebound that needs a benign inflation print to extend, a ceasefire that just absorbed weekend strikes, and a SpaceX float likelier to define the top of the cycle than confirm its continuation. Fade rallies into the 51,000 zone with stops kept tight above, treat tactical longs near 50,500 as fades rather than adds, and assume CPI is the data point that decides the next 1,000 points in either direction.
Dow Jones 5-minute chart
Dow Jones FAQs
The Dow Jones Industrial Average, one of the oldest stock market indices in the world, is compiled of the 30 most traded stocks in the US. The index is price-weighted rather than weighted by capitalization. It is calculated by summing the prices of the constituent stocks and dividing them by a factor, currently 0.152. The index was founded by Charles Dow, who also founded the Wall Street Journal. In later years it has been criticized for not being broadly representative enough because it only tracks 30 conglomerates, unlike broader indices such as the S&P 500.
Many different factors drive the Dow Jones Industrial Average (DJIA). The aggregate performance of the component companies revealed in quarterly company earnings reports is the main one. US and global macroeconomic data also contributes as it impacts on investor sentiment. The level of interest rates, set by the Federal Reserve (Fed), also influences the DJIA as it affects the cost of credit, on which many corporations are heavily reliant. Therefore, inflation can be a major driver as well as other metrics which impact the Fed decisions.
Dow Theory is a method for identifying the primary trend of the stock market developed by Charles Dow. A key step is to compare the direction of the Dow Jones Industrial Average (DJIA) and the Dow Jones Transportation Average (DJTA) and only follow trends where both are moving in the same direction. Volume is a confirmatory criteria. The theory uses elements of peak and trough analysis. Dow’s theory posits three trend phases: accumulation, when smart money starts buying or selling; public participation, when the wider public joins in; and distribution, when the smart money exits.
There are a number of ways to trade the DJIA. One is to use ETFs which allow investors to trade the DJIA as a single security, rather than having to buy shares in all 30 constituent companies. A leading example is the SPDR Dow Jones Industrial Average ETF (DIA). DJIA futures contracts enable traders to speculate on the future value of the index and Options provide the right, but not the obligation, to buy or sell the index at a predetermined price in the future. Mutual funds enable investors to buy a share of a diversified portfolio of DJIA stocks thus providing exposure to the overall index.

Hơn một triệu người dùng dựa vào FXStreet để có dữ liệu thị trường thời gian thực, công cụ biểu đồ, góc nhìn chuyên gia và tin tức Forex. Lịch kinh tế toàn diện và các hội thảo web giáo dục giúp nhà giao dịch luôn cập nhật và đưa ra quyết định có tính toán. FXStreet có khoảng 60 nhân sự, chia giữa trụ sở Barcelona và nhiều khu vực toàn cầu.
Đọc thêm


