
GBP/JPY Price Forecast: Clears 50-day SMA, yet flatlines below 214.00
Bởi Christian Borjon Valencia
Đã cập nhật: 13 May 2026


BÀI VIẾT PHỔ BIẾN

The GBP/JPY hovers around 213.50 on Wednesday, finishing the session barely unchanged, up a mediocre 0.04% as the Yen weakened against most G10 FX currencies.
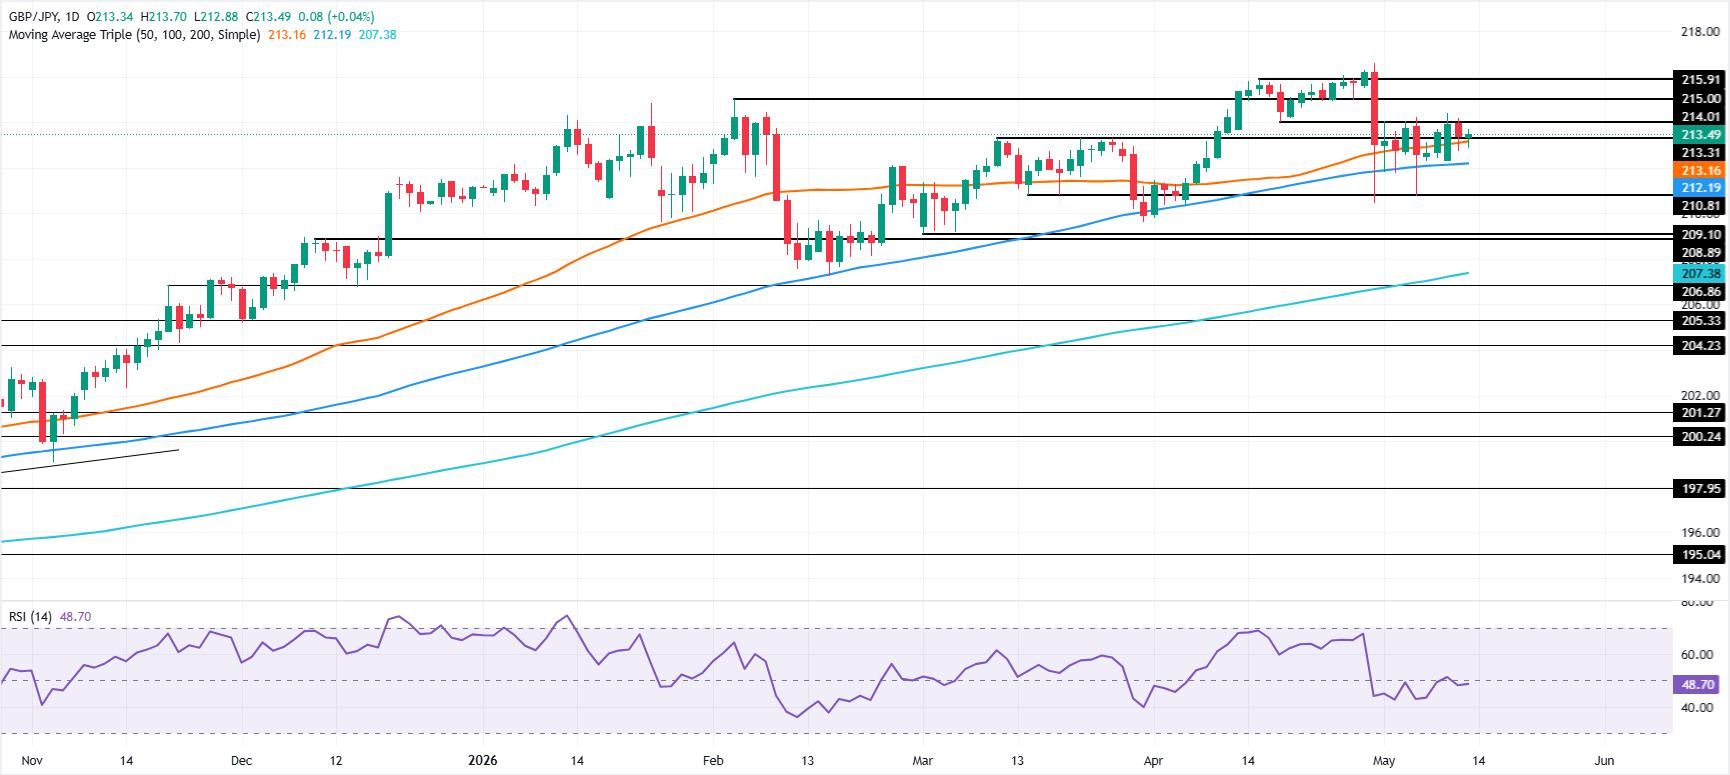
- GBP/JPY holds above 50-day SMA as 213.50 caps upside.
- RSI flat near 50 shows buyers and sellers remain balanced.
- Break above 214.00 exposes 214.43 and 215.00 resistance levels.
The GBP/JPY hovers around 213.50 on Wednesday, finishing the session barely unchanged, up a mediocre 0.04% as the Yen weakened against most G10 FX currencies. Sellers' failure to drive the cross-pair below the 50-day Simple Moving Average (SMA) at 213.16 opened the door for a recovery, with buyers eyeing the 214.00 mark.
GBP/JPY Price Forecast: Technical outlook
Following the April 30 intervention, the GBP/JPY bottomed around 210.00-212.00, with buyers pushing the spot price past the 50-day SMA but capped on the upside by the psychological 213.50 level.
The Relative Strength Index (RSI) shows that neither buyers nor sellers are in control, with the indicator flat around the 50 neutral level.
Above, the first resistance for GBP/JPY is at 214.00. A breach of the latter exposes the May 11 daily high of 214.43, followed by the 215.00 psychological level. Once cleared, overhead lies the year-to-date (YTD) high at 216.60.
For a bearish resumption, GBP/JPY must drop below the 50-day SMA and also clear the 213.00 mark. Below, the next area of interest is the 100-day SMA at 212.19, before the pair extended its losses towards the May 6 swing low at 210.76.
GBP/JPY Price Chart – Daily
Japanese Yen Price This week
The table below shows the percentage change of Japanese Yen (JPY) against listed major currencies this week. Japanese Yen was the strongest against the British Pound.
| USD | EUR | GBP | JPY | CAD | AUD | NZD | CHF | |
|---|---|---|---|---|---|---|---|---|
| USD | 0.26% | 0.20% | 0.74% | 0.18% | -0.51% | 0.03% | 0.47% | |
| EUR | -0.26% | -0.07% | 0.55% | -0.10% | -0.79% | -0.25% | 0.20% | |
| GBP | -0.20% | 0.07% | 0.11% | -0.05% | -0.74% | -0.19% | 0.26% | |
| JPY | -0.74% | -0.55% | -0.11% | -0.63% | -1.27% | -0.72% | -0.25% | |
| CAD | -0.18% | 0.10% | 0.05% | 0.63% | -0.58% | -0.08% | 0.29% | |
| AUD | 0.51% | 0.79% | 0.74% | 1.27% | 0.58% | 0.55% | 0.98% | |
| NZD | -0.03% | 0.25% | 0.19% | 0.72% | 0.08% | -0.55% | 0.43% | |
| CHF | -0.47% | -0.20% | -0.26% | 0.25% | -0.29% | -0.98% | -0.43% |
The heat map shows percentage changes of major currencies against each other. The base currency is picked from the left column, while the quote currency is picked from the top row. For example, if you pick the Japanese Yen from the left column and move along the horizontal line to the US Dollar, the percentage change displayed in the box will represent JPY (base)/USD (quote).

Hơn một triệu người dùng dựa vào FXStreet để có dữ liệu thị trường thời gian thực, công cụ biểu đồ, góc nhìn chuyên gia và tin tức Forex. Lịch kinh tế toàn diện và các hội thảo web giáo dục giúp nhà giao dịch luôn cập nhật và đưa ra quyết định có tính toán. FXStreet có khoảng 60 nhân sự, chia giữa trụ sở Barcelona và nhiều khu vực toàn cầu.
Đọc thêm


