

Hyperliquid: Short-term noise in HYPE price masks breakout potential to $100
- Hyperliquid edges lower on Thursday, extending losses so far this week, totaling around 7%.
- Retail demand is mixed, with waning Open Interest and a funding rate.
- Rising HIP-3 OI with steady volume reflects growing demand for tokenized RWAs on Hyperliquid.
Hyperliquid (HYPE) continues to slide for the fourth consecutive day this week as retail demand eases amid broader market risk-off sentiment. A surge in HIP-3 Open Interest reflects steady demand for tokenized Real World Assets (RWAs), amid institutional inflows that support the broader upward trend.

Technically, HYPE should secure a daily close above the $75-$77 resistance zone for a potential rally toward $100.
Short-term pressure on HYPE
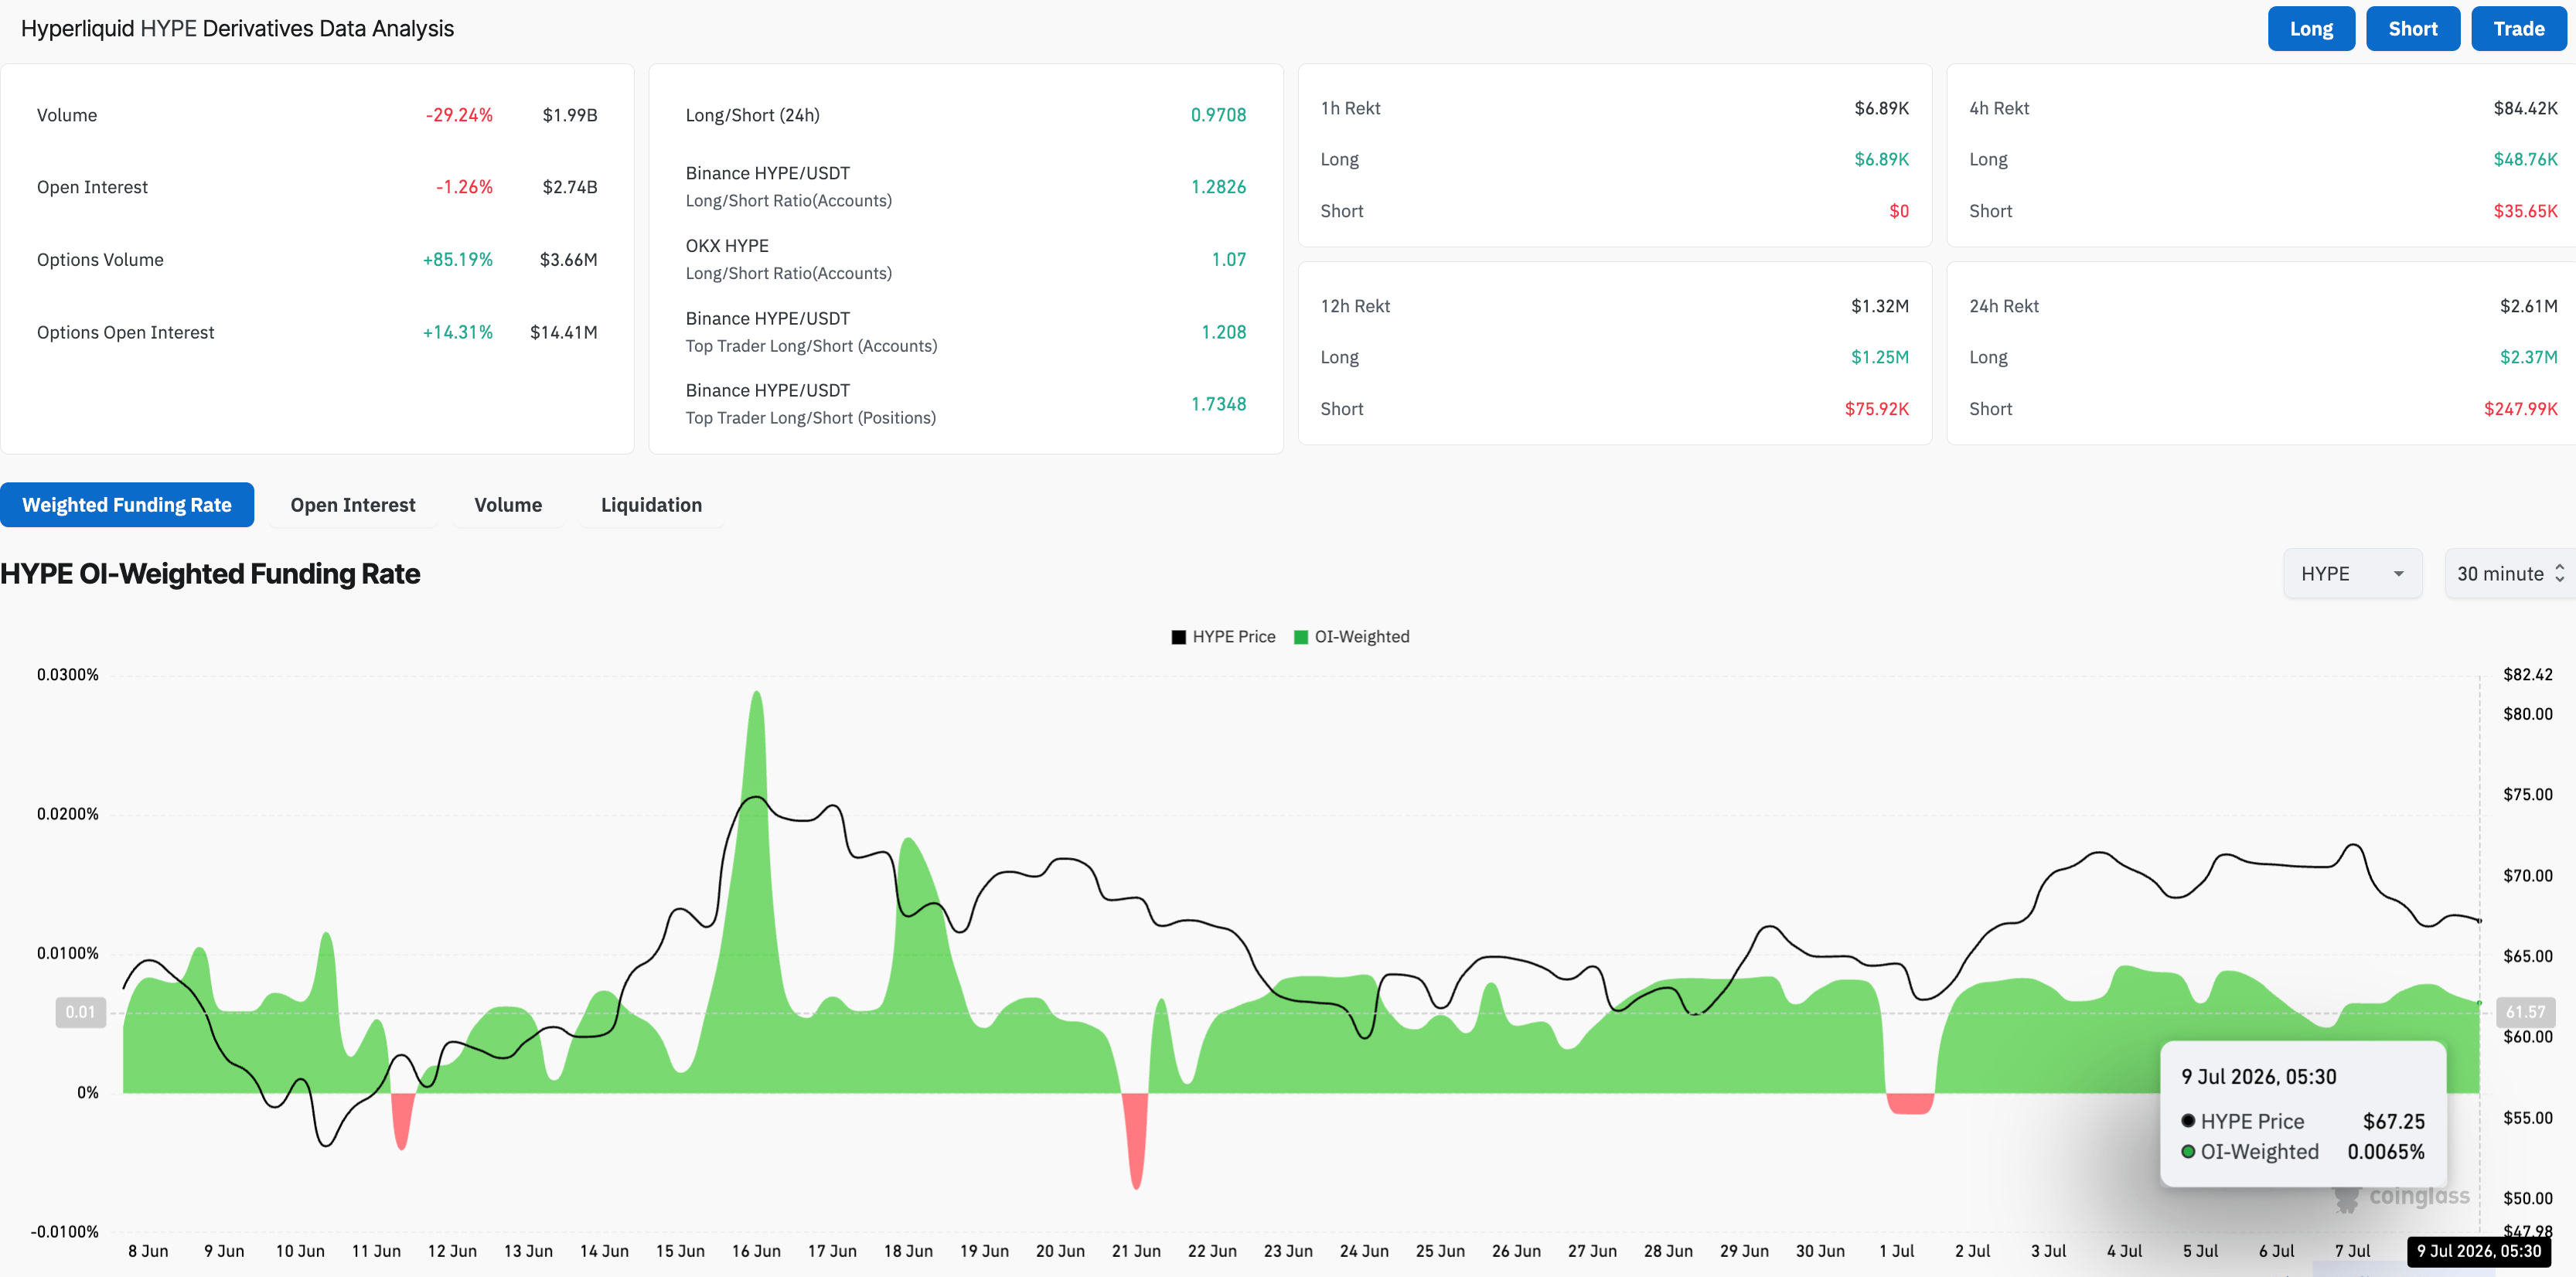
Hyperliquid’s retail strength eases in the short term as the broader crypto market's risk appetite wanes amid renewed tensions in the Middle East. CoinGlass data shows the HYPE futures Open Interest (OI) slipped to $2.74 billion, reflecting a mild outflow of leveraged positions, while a 29% decline in trading volume over the last 24 hours to $1.99 billion reaffirms the reduced demand.
Still, the funding rate at 0.0065%, down from 0.0078% the previous day, suggests that bullish sentiment sustains among traders despite short-term downside pressure. This mixed retail activity points to a wait-and-see approach among traders anticipating increased volatility amid geopolitical tensions.
Long-term outlook remains bullish
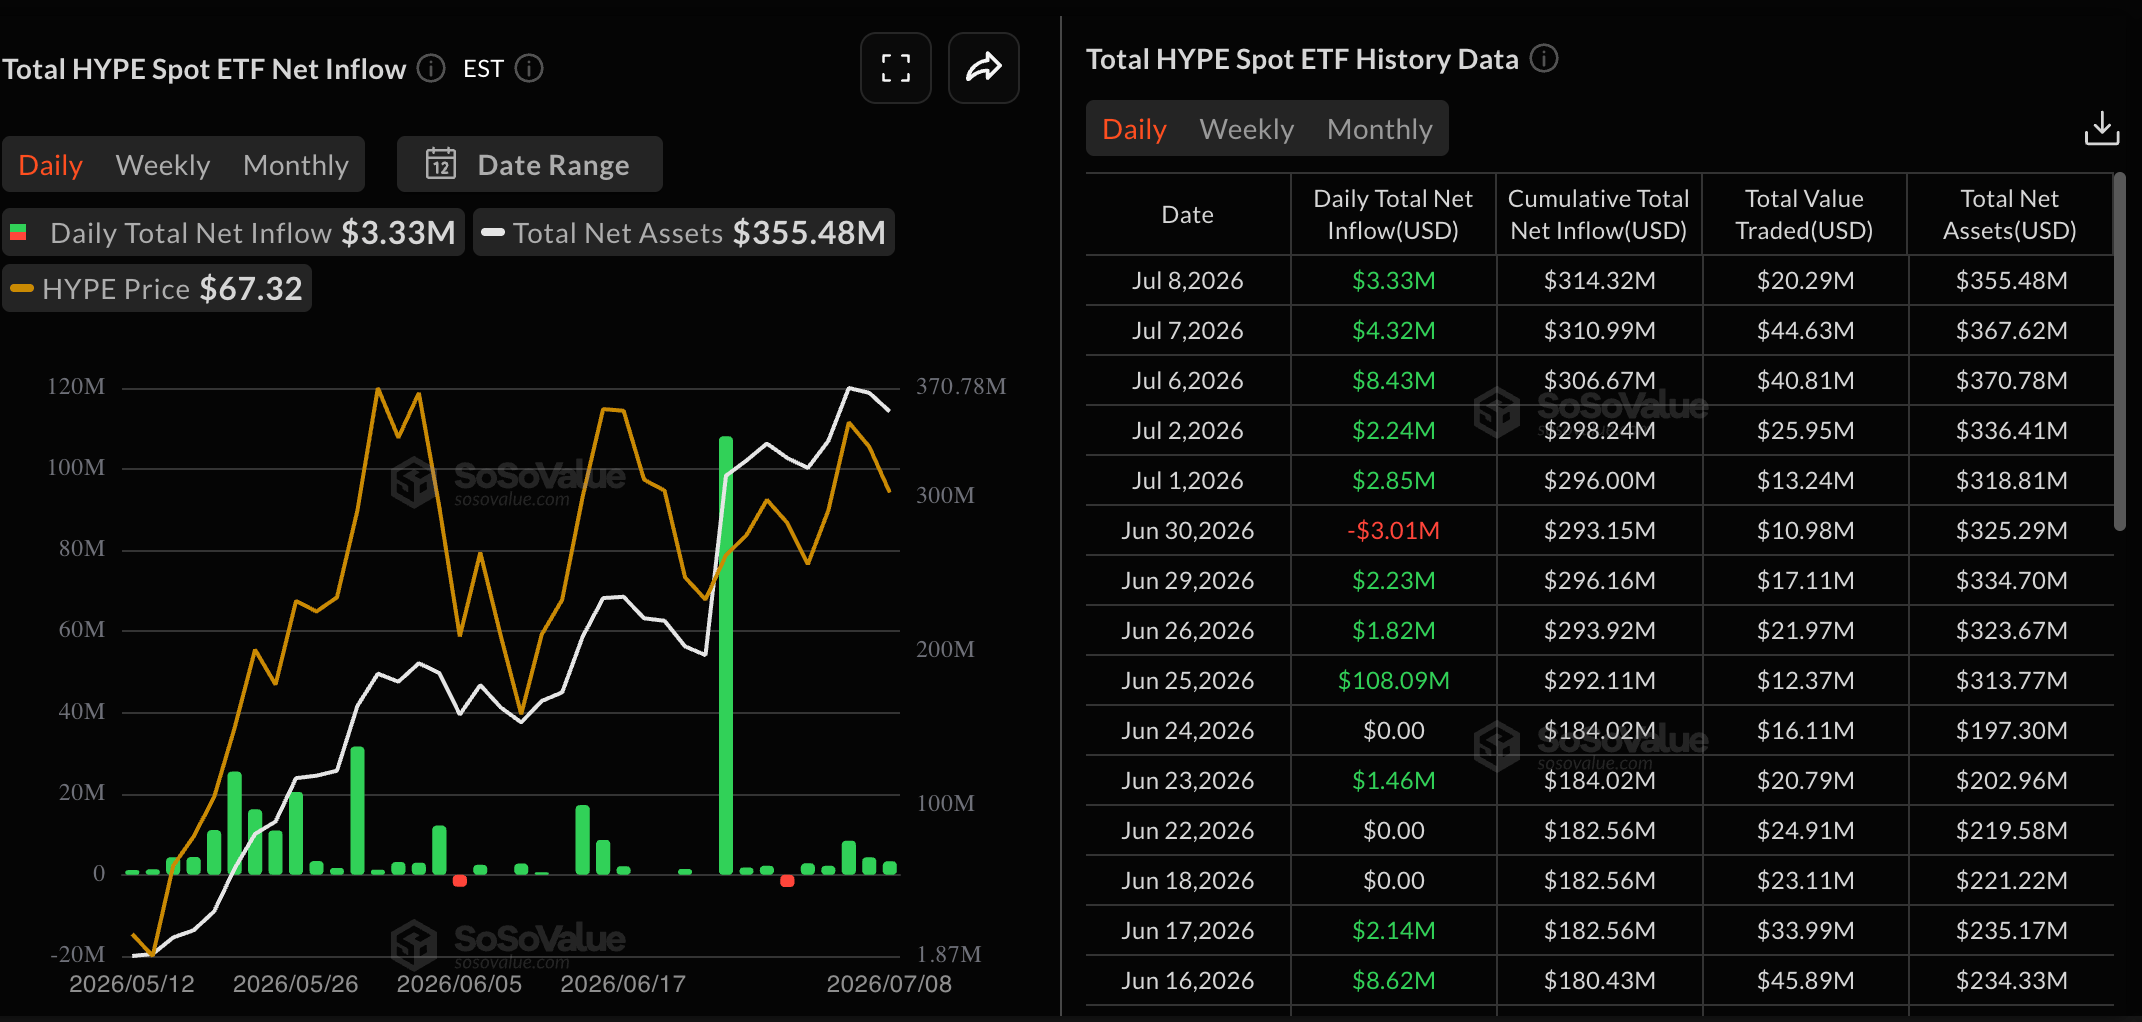
Institutional investors and global commodities traders remain interested in Hyperliquid, which supports its long-term bullish outlook. Data show HYPE-focused Exchange-Traded Funds (ETFs) recorded $3.33 million in inflows on Wednesday, bringing weekly inflows to $16.08 million so far.
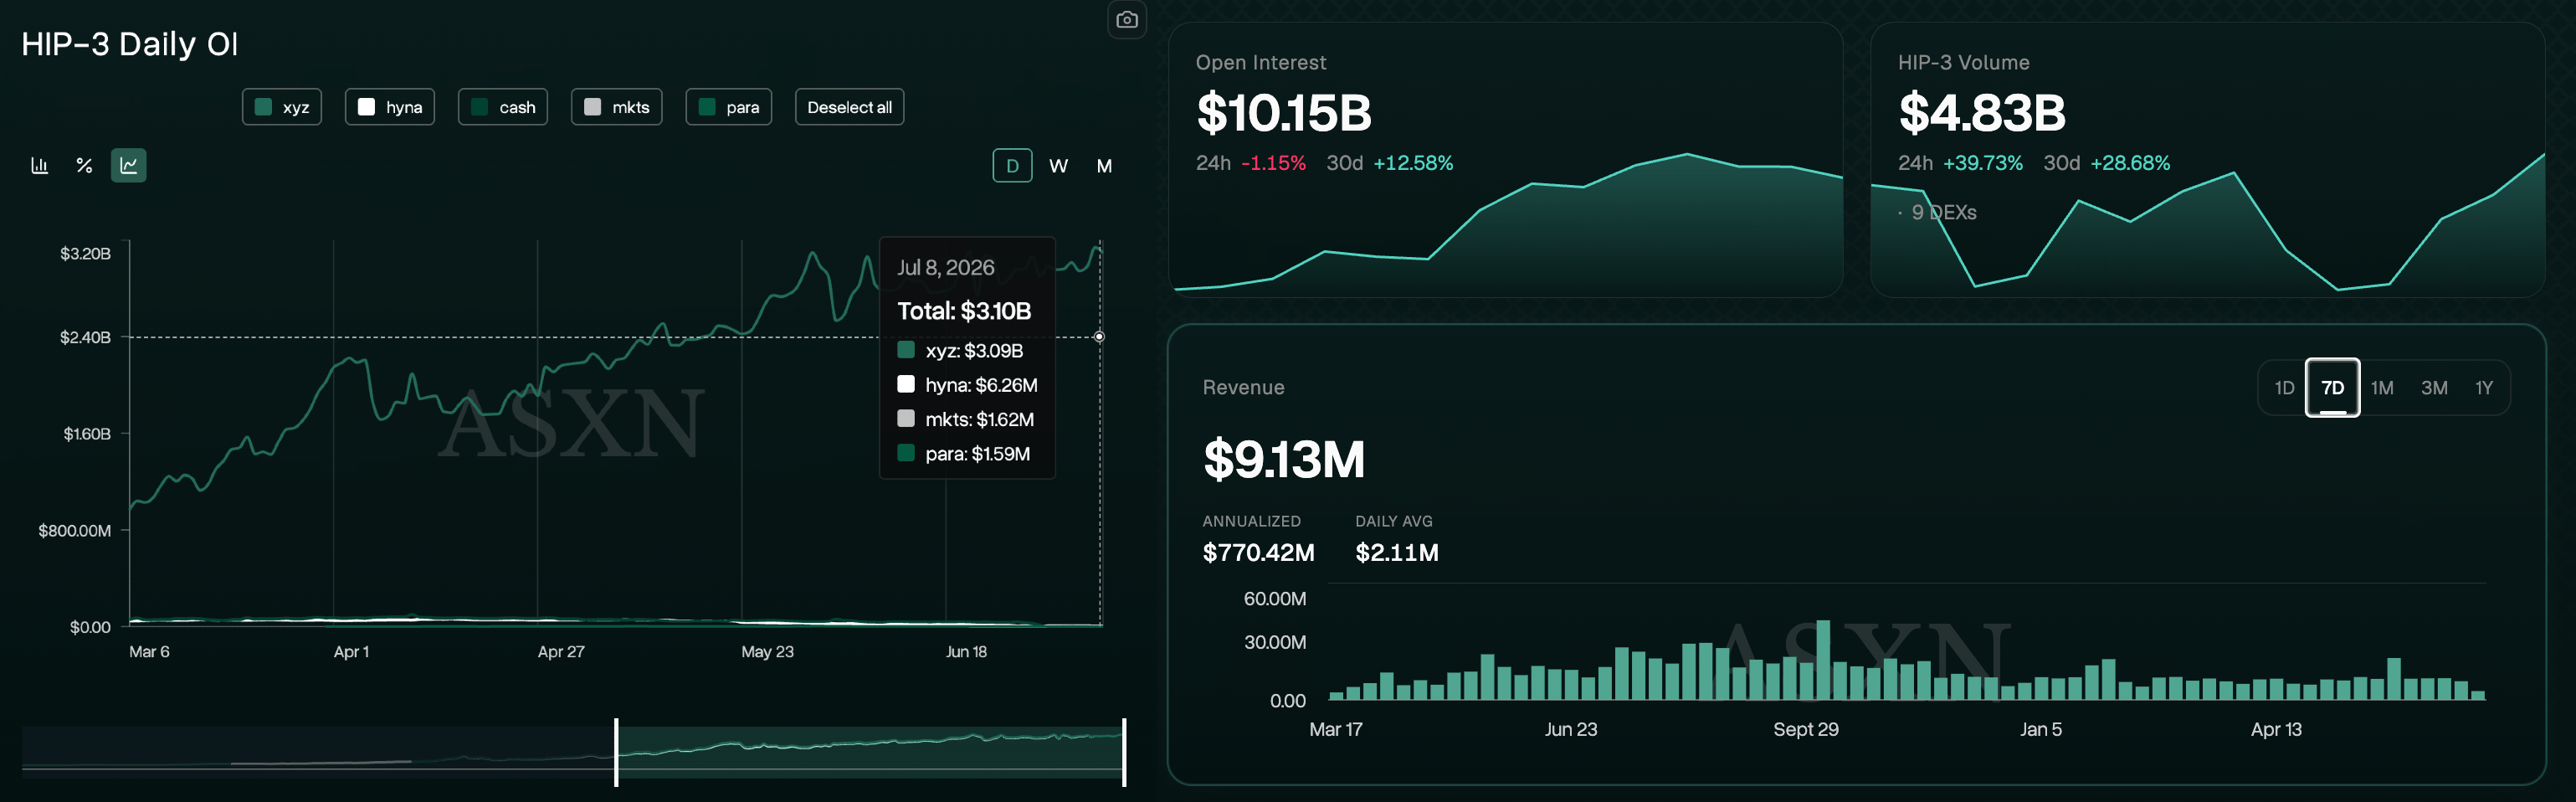
On the other hand, the HIP-3 arm of Hyperliquid, which offers multiple RWA-focused perpetual contracts, witnesses a steady increase in OI and trading volume. Data show a steady increase in HIP-3 OI to $3.10 billion on Wednesday, with volume rising 40% over the last 24 hours and 28% over the last 30 days. In addition, revenue has stabilized around $10 million over the last four weeks, reaffirming firm demand among users.
Will HYPE rally to $100?
Hyperliquid shows a mild short-term correction, approaching a local support trendline at $66.54, which reinforces the constructive structure. Still, HYPE maintains a broader bullish bias as price holds above both the 50-day and 200-day Exponential Moving Averages (EMAs) at $62.53 and $48.33, respectively.
From a technical perspective, the June 1 high at $75.76 and the R1 Pivot Point at $77.09 serve as the overhead barrier, forming an ascending triangle pattern with the upward-sloping trendline. If HYPE rebounds to clear this zone, it could target the R2 and R3 Pivot levels at $89.14 and $101.35, respectively.
That said, the Moving Average Convergence Divergence (MACD) hovers above its signal line, while the Relative Strength Index (RSI) is at 52, hovering above its midline. Taken together, the indicators indicate neutral-to-positive momentum, with modest upside pressure without overbought conditions.
Looking down, a deeper pullback below the 50-day EMA at $62.53 could expose the S1 Pivot level at $52.83 as a more significant floor, while the 200-day EMA at $48.33 marks the broader bullish cycle base.
(The technical analysis of this story was written with the help of an AI tool. Know more.)














