

Giao dịch
Khám phá đa dạng thị trường với mức giá cạnh tranh, thanh khoản sâu và các công cụ giao dịch tiên tiến.
Tìm hiểu thêm 
Nền tảng
Giao dịch mượt mà với nền tảng mạnh mẽ của TMGM, được xây dựng để đảm bảo tốc độ, độ chính xác và trải nghiệm giao dịch vượt trội.
Tìm hiểu thêm Nền tảng Giao dịch
Công cụ Giao dịch
Học viện
Học các kiến thức cơ bản về giao dịch với các tài nguyên thân thiện cho người mới bắt đầu, bao gồm hướng dẫn, hội thảo trực tuyến và nhận định thị trường.
Tìm hiểu thêm Học viện TMGM
Tin tức & Phân tích
Nhận cập nhật thị trường theo thời gian thực và phân tích chuyên gia để luôn dẫn đầu các cơ hội giao dịch
Tìm hiểu thêm Tin tức & Phân tích
Giới thiệu
Tìm hiểu điều gì làm nên sự khác biệt của TMGM — sự hiện diện toàn cầu, sức mạnh quy định và cam kết đổi mới trong giao dịch.
Tìm hiểu thêm Tại sao chọn TMGM
Japanese Yen trades broadly flat against US Dollar, NFP data eyed
- The Japanese Yen consolidates at around 158.42 against the US Dollar ahead of the US NFP data for July.
- The US NFP data is expected to significantly influence Fed interest rate expectations.
- An absence of US-Japan follow-up intervention weighs on the Japanese Yen.
The Japanese Yen (JPY) trades almost flat against the US Dollar (USD) at around 158.42 during the European trading session on Friday. The USD/JPY pair consolidates as investors await the United States (US) Nonfarm Payrolls (NFP) data for July, which will be published at 12:30 GMT.

Deutsche Bank looks for modest payrolls gain with US unemployment steady at 4.2%
Economists at Deutsche Bank expect only a modest improvement in today’s US labour market report, projecting “a slight uptick in headline (+65k forecast vs. +57k previously) and private (+65k vs. +49k) payrolls.” At the same time, they see little change in joblessness, anticipating that “the unemployment rate [will] remain unchanged at 4.2% on a rounded basis versus 4.19% last month, which was its lowest reading in a year, even if it was accompanied by a 0.3pp fall in the labour force participation.”
Ahead of the US NFP data, the US Dollar Index (DXY), which gauges the Greenback’s value against six major currencies, trades flat at around 100.00.
The impact of the US NFP data will be significant for the Federal Reserve’s (Fed) monetary policy outlook in the absence of so-called “forward guidance” from the central bank.
Meanwhile, the Japanese Yen (JPY) has broadly underperformed this week due to the absence of follow-up US-Japan joint intervention.
Japanese Yen Price This week
The table below shows the percentage change of Japanese Yen (JPY) against listed major currencies this week. Japanese Yen was the weakest against the US Dollar.
| USD | EUR | GBP | JPY | CAD | AUD | NZD | CHF | |
|---|---|---|---|---|---|---|---|---|
| USD | 0.23% | 0.34% | 0.81% | 0.08% | 0.06% | 0.53% | 0.59% | |
| EUR | -0.23% | 0.12% | 0.58% | -0.14% | -0.07% | 0.32% | 0.39% | |
| GBP | -0.34% | -0.12% | 0.15% | -0.26% | -0.18% | 0.20% | 0.28% | |
| JPY | -0.81% | -0.58% | -0.15% | -0.65% | -0.60% | -0.16% | -0.10% | |
| CAD | -0.08% | 0.14% | 0.26% | 0.65% | 0.06% | 0.51% | 0.54% | |
| AUD | -0.06% | 0.07% | 0.18% | 0.60% | -0.06% | 0.37% | 0.45% | |
| NZD | -0.53% | -0.32% | -0.20% | 0.16% | -0.51% | -0.37% | 0.08% | |
| CHF | -0.59% | -0.39% | -0.28% | 0.10% | -0.54% | -0.45% | -0.08% |
The heat map shows percentage changes of major currencies against each other. The base currency is picked from the left column, while the quote currency is picked from the top row. For example, if you pick the Japanese Yen from the left column and move along the horizontal line to the US Dollar, the percentage change displayed in the box will represent JPY (base)/USD (quote).
Yen regime seen intact as TD Securities flags scope for USD/JPY drift to 153.00
According to TD Securities, the recent intervention-driven pullback in USD/JPY does not mark a fundamental shift in the currency’s underlying dynamics. The bank argues that, “in the absence of more direct US intervention involvement, we would not see the FX regime as structurally different for JPY.” Strategists at TD Securities add that the “intervention-led USD/JPY selloff could continue moderately to 153.00,” but stress that this would still be consistent with the prevailing framework for the Yen rather than a new regime.
Last week, Japan Ministry of Finance (MoF) confirmed a US-Japan joint intervention to “counter excessive volatility and disorderly movements in the Japanese yen in recent months”.
On Monday, Japan Finance Minister (FM) Satsuki Katayama confirmed that Japan “won't hesitate to carry out more forex intervention with the US”.
USD/JPY Technical Analysis
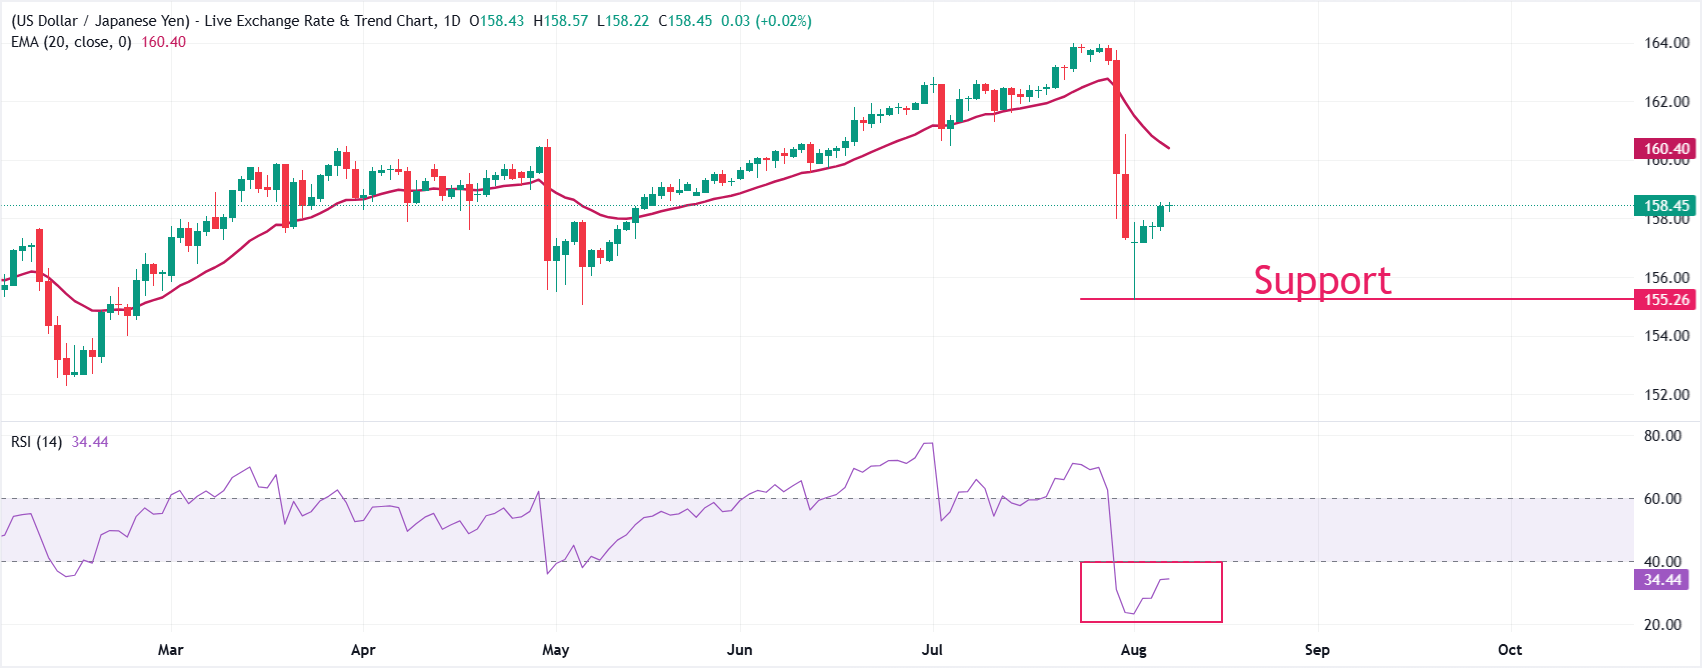
USD/JPY trades firmly at 158.44, maintaining a bearish near-term bias as spot holds below the 20-day exponential moving average (EMA) at 160.40. The pair has retreated sharply from recent highs, and price action remains capped by the overhead EMA, suggesting that recovery attempts are likely to face selling pressure. The Relative Strength Index (RSI) at 34.35 sits just above oversold territory, hinting that while downside momentum has cooled, sellers still retain the upper hand as long as price stays under the 160.40 resistance.
On the topside, initial resistance is located at the 20-day EMA at 160.40, which acts as the first barrier that bulls would need to reclaim to alleviate the current bearish tone. A sustained break above this level would open the way for a deeper corrective rebound, while failure to overcome 160.40 keeps risks skewed toward further downside, with traders watching for the emergence of new structural supports below the current price to define the next potential floor.
(The technical analysis of this story was written with the help of an AI tool. Know more.)
Economic Indicator
Nonfarm Payrolls
The Nonfarm Payrolls release presents the number of new jobs created in the US during the previous month in all non-agricultural businesses; it is released by the US Bureau of Labor Statistics (BLS). The monthly changes in payrolls can be extremely volatile. The number is also subject to strong reviews, which can also trigger volatility in the Forex board. Generally speaking, a high reading is seen as bullish for the US Dollar (USD), while a low reading is seen as bearish, although previous months' reviews and the Unemployment Rate are as relevant as the headline figure. The market's reaction, therefore, depends on how the market assesses all the data contained in the BLS report as a whole.
Read more.Next release: Fri Aug 07, 2026 12:30
Frequency: Monthly
Consensus: 80K
Previous: 57K
Source: US Bureau of Labor Statistics
America’s monthly jobs report is considered the most important economic indicator for forex traders. Released on the first Friday following the reported month, the change in the number of positions is closely correlated with the overall performance of the economy and is monitored by policymakers. Full employment is one of the Federal Reserve’s mandates and it considers developments in the labor market when setting its policies, thus impacting currencies. Despite several leading indicators shaping estimates, Nonfarm Payrolls tend to surprise markets and trigger substantial volatility. Actual figures beating the consensus tend to be USD bullish.
BÀI VIẾT PHỔ BIẾN
1Fed’s Williams says worst inflation shocks have passed2United States Dollar Index approaches yearly peak on hawkish Fed outlook3Fed’s Williams says no rush after September hike4Fed’s Goolsbee says persistent inflation is like “playing with fire”5Forex Today: Focus shifts to US PCE, ADP, inflation in OZ and Chinese PMIs6Musalem says Fed must explain decisions without policy pledges7Fed’s Barr calls economy “strikingly” resilient, defends last hike8Silver price retreats as rising US yields, Hormuz tensions bolster US Dollar9Fed’s Barr says policy needs recalibration, more adjustments likely

Bắt đầu ngay!
Đăng ký và truy cập Thị trường Toàn cầu trong vòng chưa đầy 3 phút

Kết nối với chúng tôi









Liên hệ
Điện thoại: +61 2 8036 8388
Fax: +61 2 8036 8388
Email: support@tmgm.com
Website: https://www.tmgm.com



Thông tin được cung cấp trên trang web này chỉ mang tính chất chung và không cấu thành lời khuyên tài chính cá nhân. Trước khi hành động dựa trên bất kỳ thông tin nào trên trang web này, bạn nên cân nhắc mức độ phù hợp của thông tin đó với mục tiêu, tình hình tài chính và nhu cầu của mình. Đầu tư vào CFD và Hợp đồng Ký quỹ FX tiềm ẩn rủi ro đáng kể và không phù hợp với tất cả nhà đầu tư. Bạn có thể mất nhiều hơn khoản tiền nạp ban đầu của mình. Bạn không sở hữu hoặc có bất kỳ quyền lợi nào đối với tài sản cơ sở. Chúng tôi khuyến nghị bạn tìm kiếm tư vấn độc lập và đảm bảo rằng bạn hiểu đầy đủ các rủi ro liên quan trước khi giao dịch. Điều quan trọng là bạn phải đọc và cân nhắc tài liệu công bố thông tin trước khi mua bất kỳ sản phẩm nào được liệt kê trên trang web. Thông tin và quảng cáo được cung cấp trên trang web này không nhằm mục đích sử dụng bởi bất kỳ cá nhân nào tại bất kỳ quốc gia hoặc khu vực pháp lý nào mà việc sử dụng đó sẽ trái với luật pháp và quy định địa phương. Các Sản phẩm và Dịch vụ được cung cấp trên trang web này không dành cho cư dân Hoa Kỳ, Malaysia và Thái Lan.
TMGM được ủy quyền và quản lý tại nhiều khu vực pháp lý khác nhau.
Trademax Australia Limited, giao dịch dưới tên TMGM, được quản lý bởi Ủy ban Chứng khoán và Đầu tư Úc (ASIC), AFSL số 436416 và có trụ sở tại Tầng 28, One International Tower, 100 Barangaroo Avenue, 2000 Sydney, NSW Australia.
Email: support@tmgm.com.au
Trademax Global Limited, giao dịch dưới tên TMGM, được ủy quyền và quản lý bởi Ủy ban Dịch vụ Tài chính Vanuatu (VFSC), số đăng ký 40356 và được đăng ký tại 1276, Kumul Highway, Port Vila, Vanuatu, Cộng hòa Vanuatu.
Email: support@tmgm.com
Trademax Global Markets (SE) Limited, hoạt động dưới tên TMGM, được ủy quyền và điều chỉnh bởi Cơ quan Dịch vụ Tài chính (FSA) của Seychelles, với số giấy phép SD224. Công ty đăng ký tại Văn phòng số 13, Providence Estate ABIS Centre, Mahe, Seychelles.
Email: support@tmgm.com
Trademax Global Markets (International) Pty Ltd, giao dịch dưới tên TMGM, được ủy quyền và quản lý bởi Ủy ban Dịch vụ Tài chính, Mauritius (FSC) với giấy phép số GB22201012, và được đăng ký tại 33, Edith Cavell Street C/o IQ EQ Fund Services (Mauritius) Ltd Port Louis, 11324 Mauritius.
Email: support@tmgm.com
Bản quyền © TMGM. Tất cả quyền được bảo lưu