

Meme Coins Overview: Dogecoin slips as Shiba Inu consolidates despite improving market sentiment
- Dogecoin slides toward $0.072 support as headwinds persist despite growing futures Open Interest.
- Shiba Inu rebounds from the critical $0.0000040 support, backed by a mild return of retail traders.
- The cryptocurrency market sentiment improves marginally despite the escalating US-Iran war.
The cryptocurrency market broadly struggles to gain momentum on Monday, with Shiba Inu (SHIB) trading around $0.0000042, while Dogecoin (DOGE) slides toward the nearest $0.072 support.
US-Iran war rages on, weighing on risk assets
Geopolitical risk flared over the weekend and on Monday as the United States (US) and Iran escalated hostilities, fueling heightened military tensions throughout the region.
The US military reported strikes on Iranian command centers, defense infrastructure, communications facilities, and missile sites. In response, Iran targeted US military positions in Kuwait and Bahrain, while the Islamic Revolutionary Guard Corps claimed responsibility for disabling two Oil tankers in the Strait of Hormuz after explosions disrupted their passage.
Despite staying relatively elevated, the West Texas Intermediate (WTI) Crude Oil prices have moderated to $81, down from a daily high of $84.
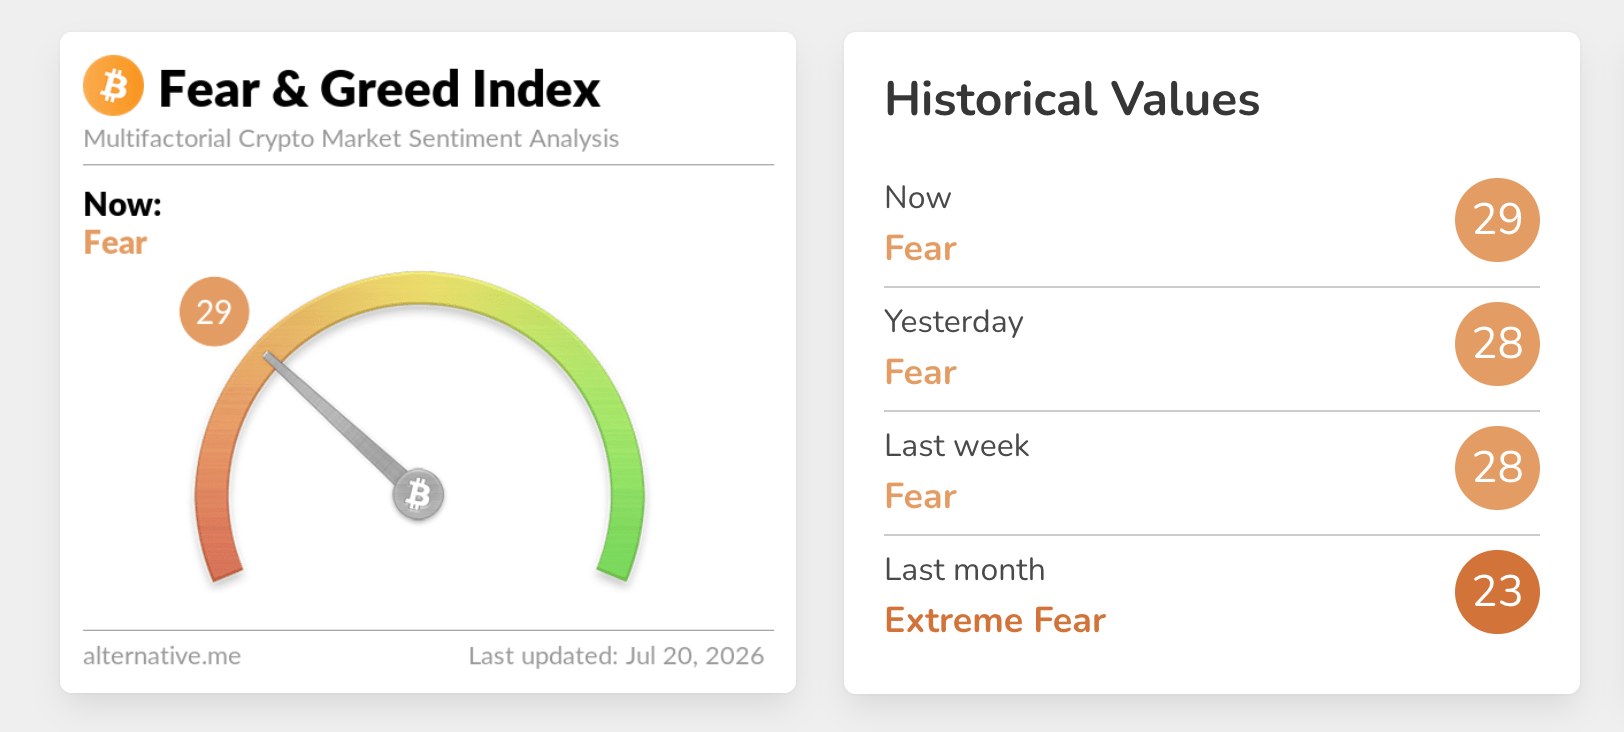
Meanwhile, the Crypto Fear & Greed Index holds at 29 on Monday, moving out of the Extreme Fear zone and indicating a measured improvement in investor sentiment. This modest rebound in risk appetite comes against the backdrop of ongoing US-Iran hostilities.
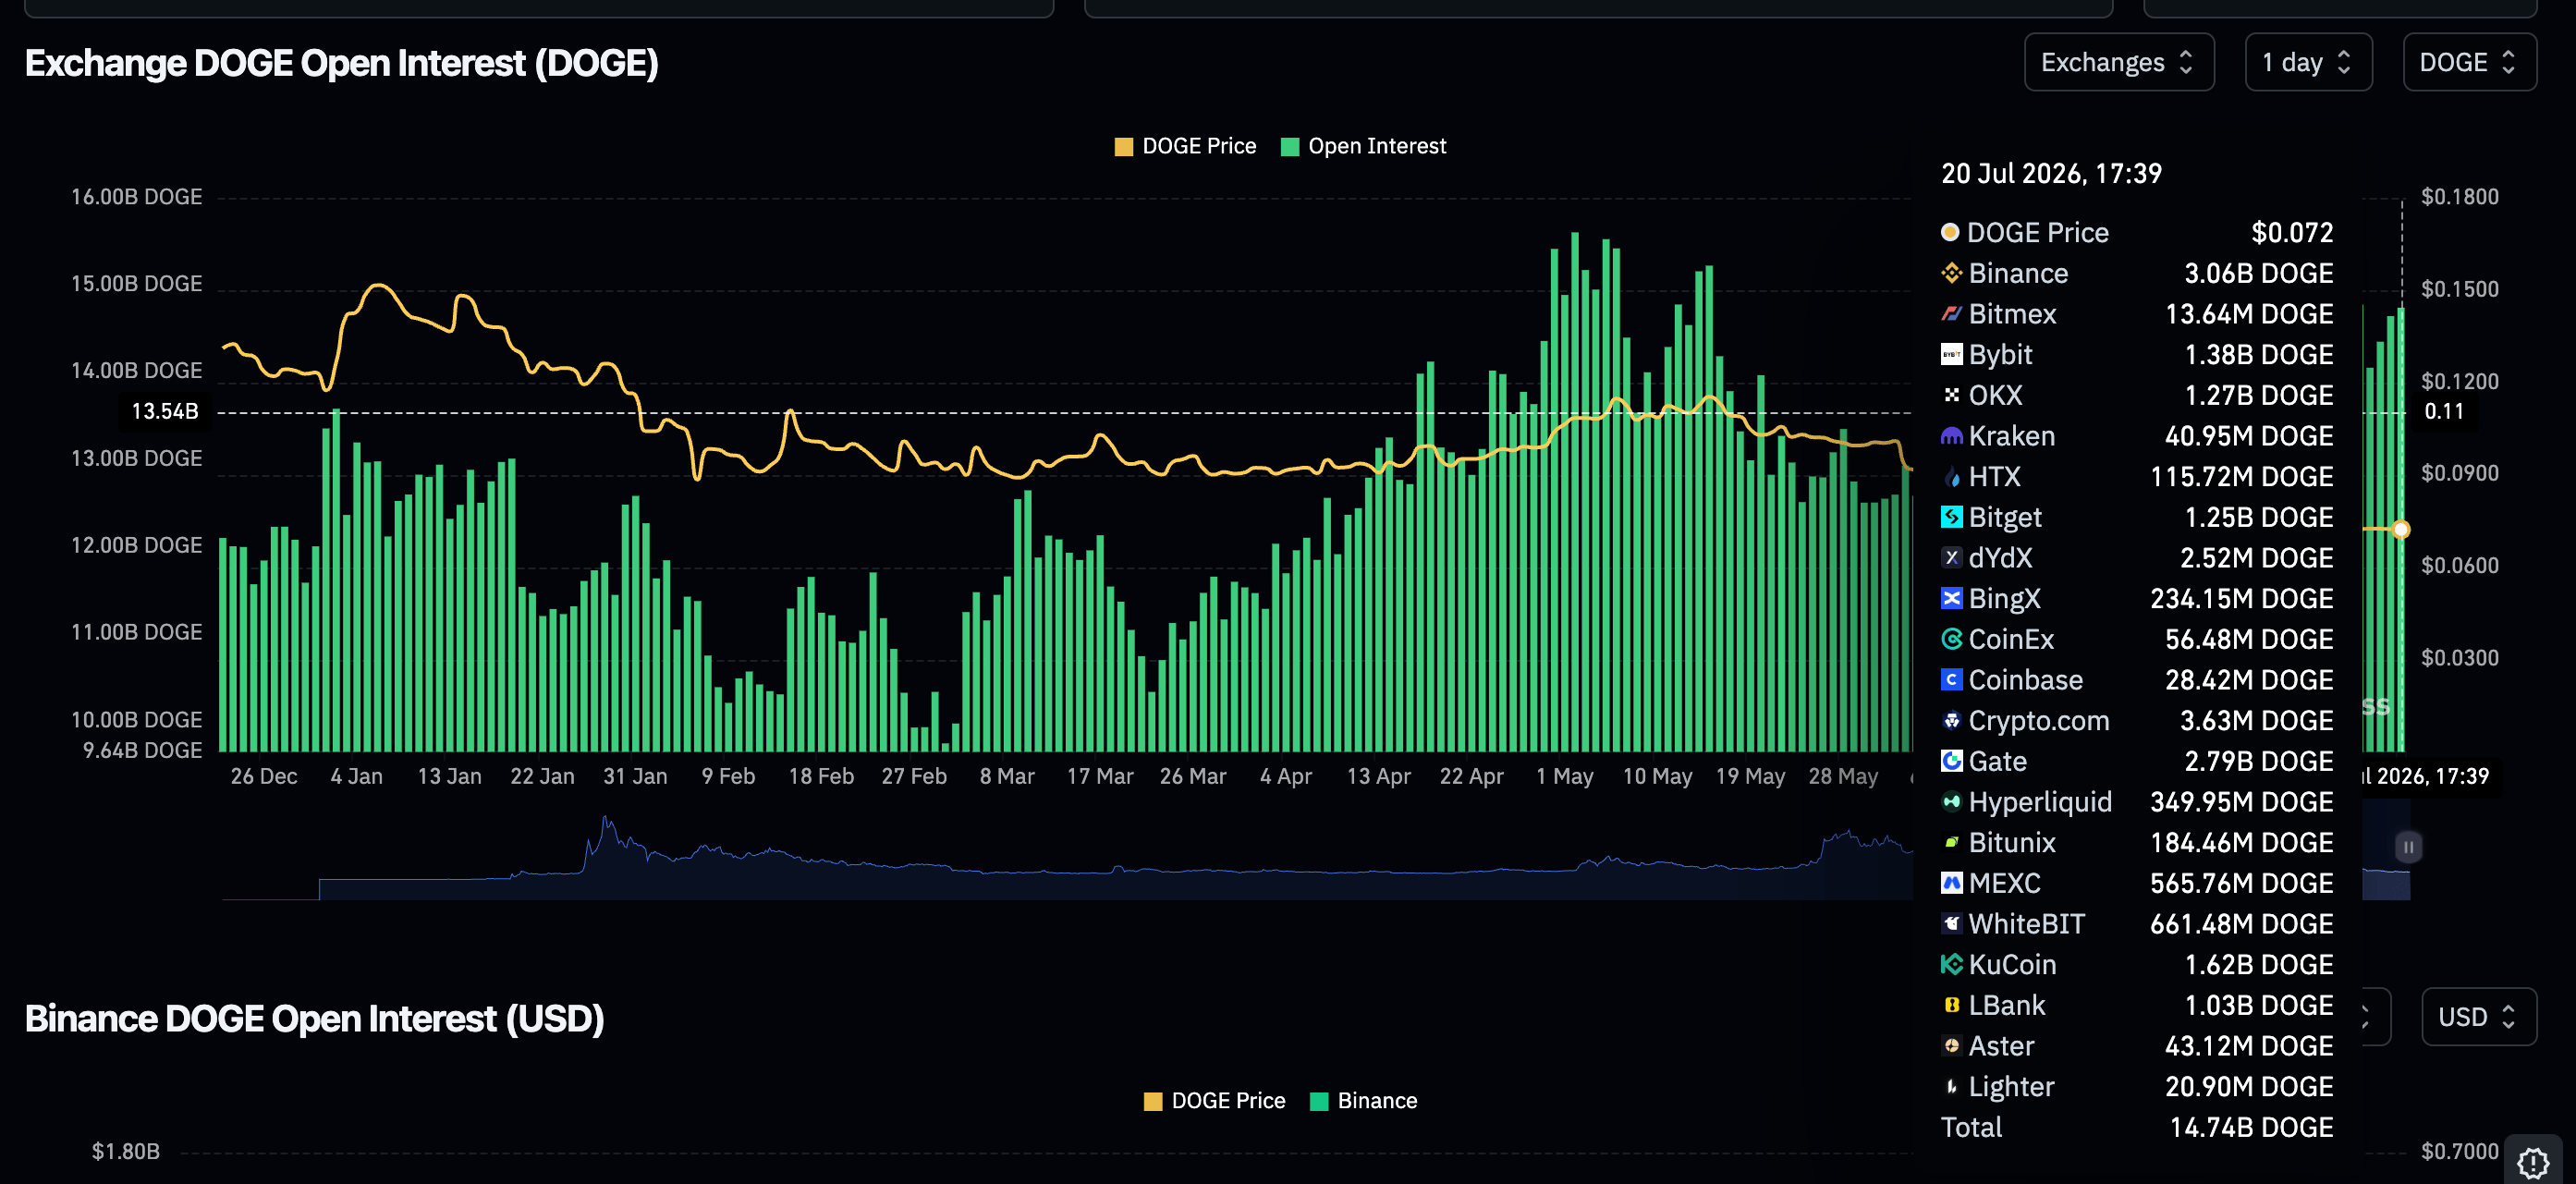
Retail appetite for Dogecoin derivatives has regained modest strength, as reflected in the perpetual futures Open Interest (OI), which averages 14.74 billion DOGE on Monday, up from 14.35 billion DOGE the day before. According to CoinGlass data, this uptick is part of a broader rebound, with OI at 12.01 billion DOGE on June 11.
If sustained, increased demand would align with the gradual improvement in risk-on sentiment, raising the odds of a steady price recovery.
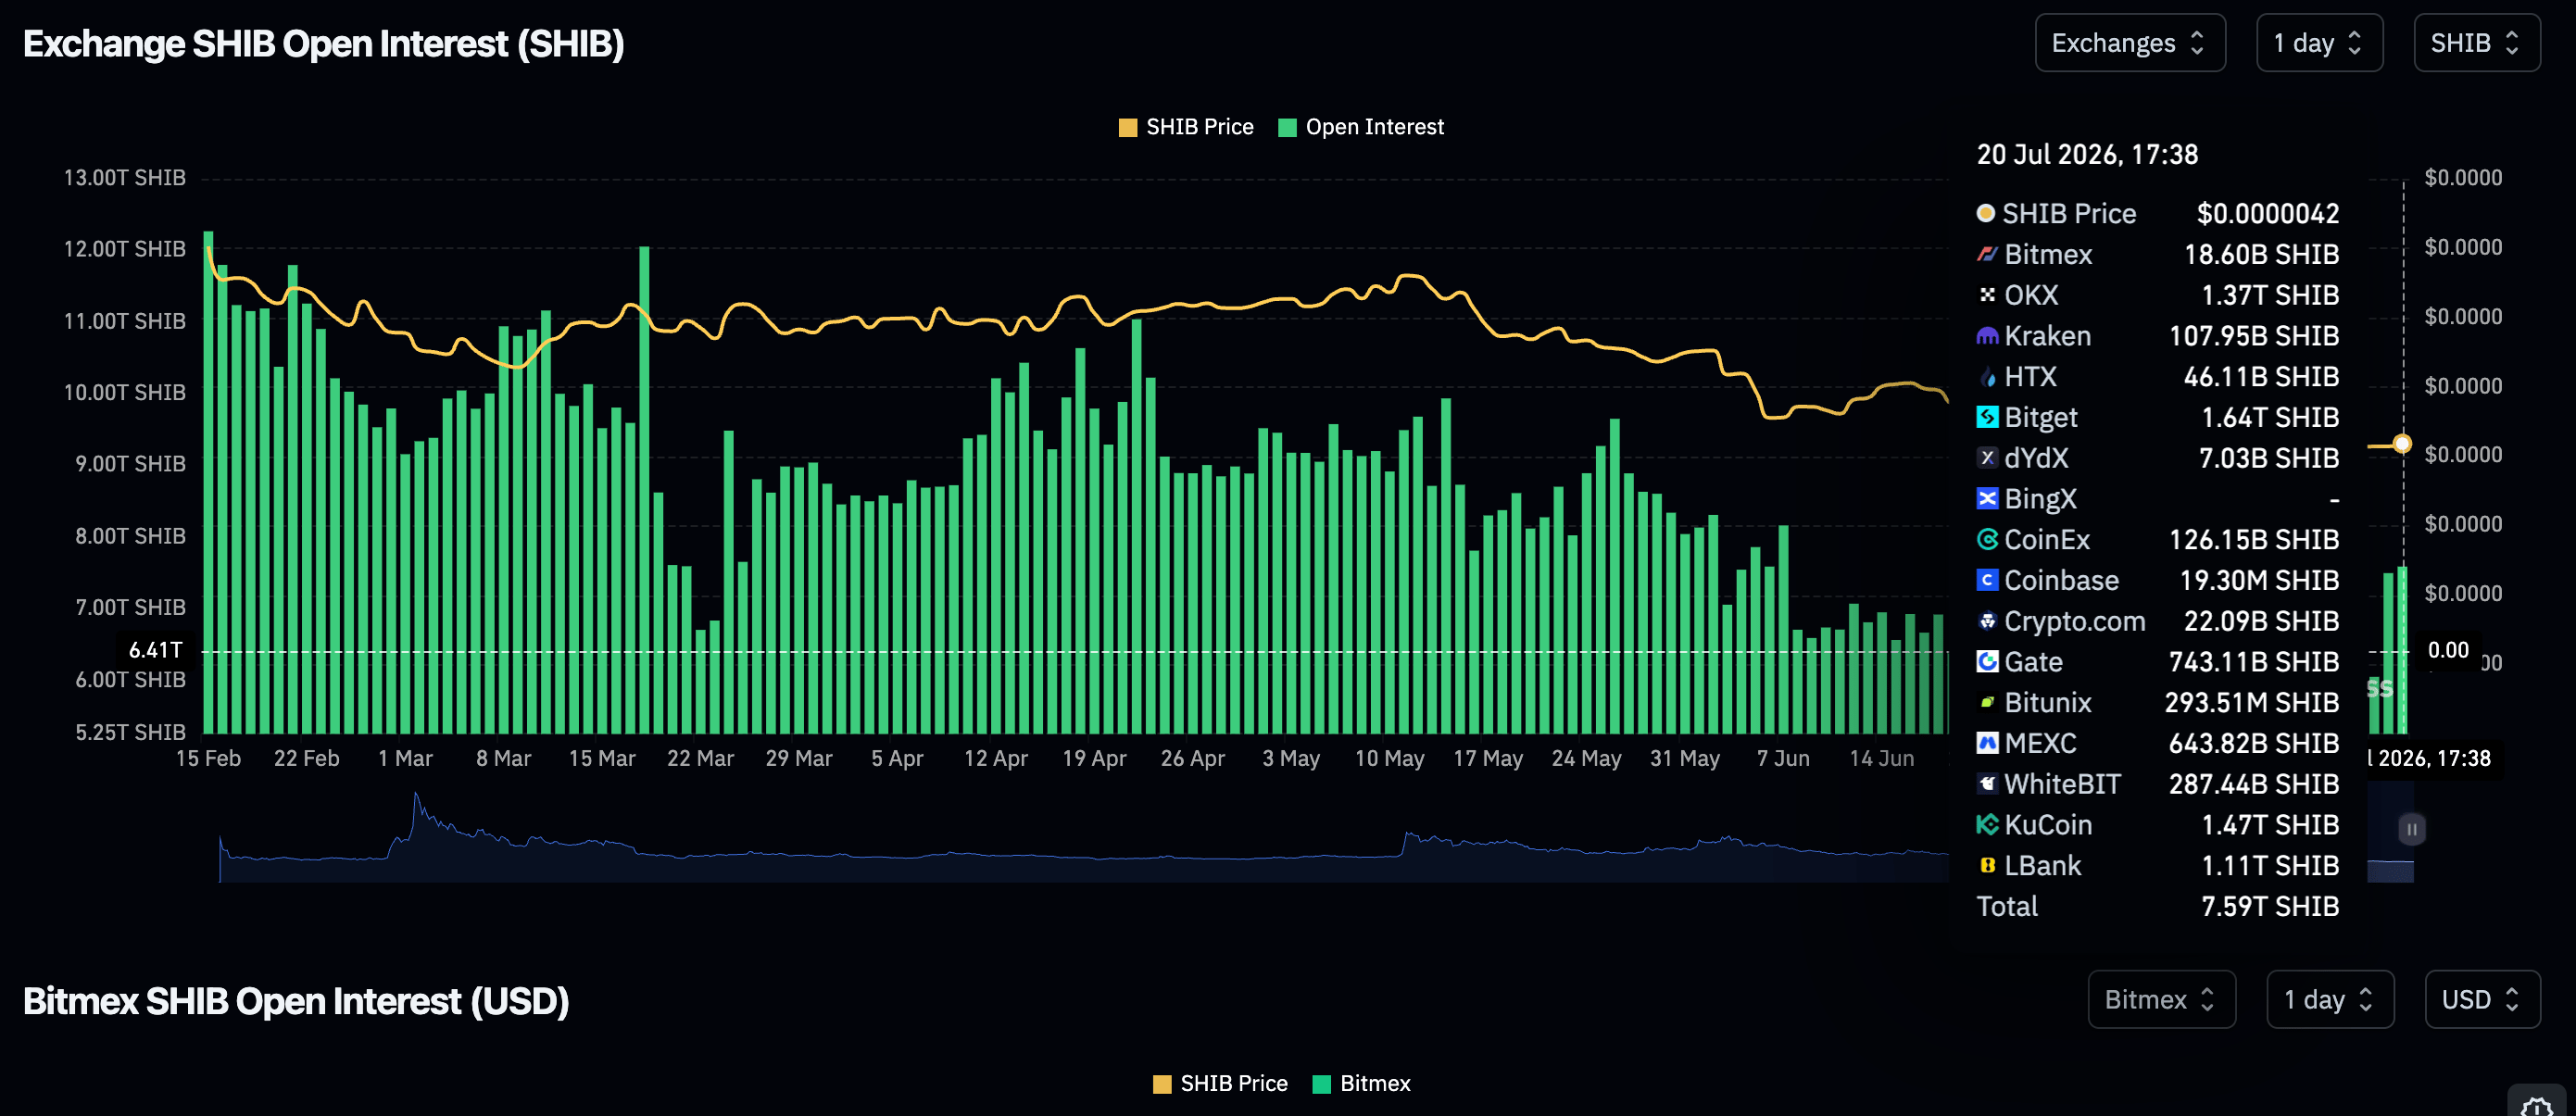
Retail investors in Shiba Inu appear to be making a gradual return to the market, with OI up on Monday, averaging nearly 8 trillion SHIB. The meme coin’s OI had plunged to roughly 5 trillion SHIB on June 24, underscoring the growing risk-on sentiment.
Price analysis: Dogecoin eyes rebound from key support
Dogecoin trades at $0.072, holding in a bearish configuration as price remains well beneath the 50-day, 100-day and 200-day Exponential Moving Averages (EMAs). The short-term tone is capped by a nearby confluence of resistance around $0.080, where the 78.6% Fibonacci retracement and the 50-day EMA converge, while the Relative Strength Index (RSI) lingers below the midline near 38 on the daily chart, hinting at weak demand despite a slightly positive but flattening Moving Average Convergence Divergence (MACD) histogram.
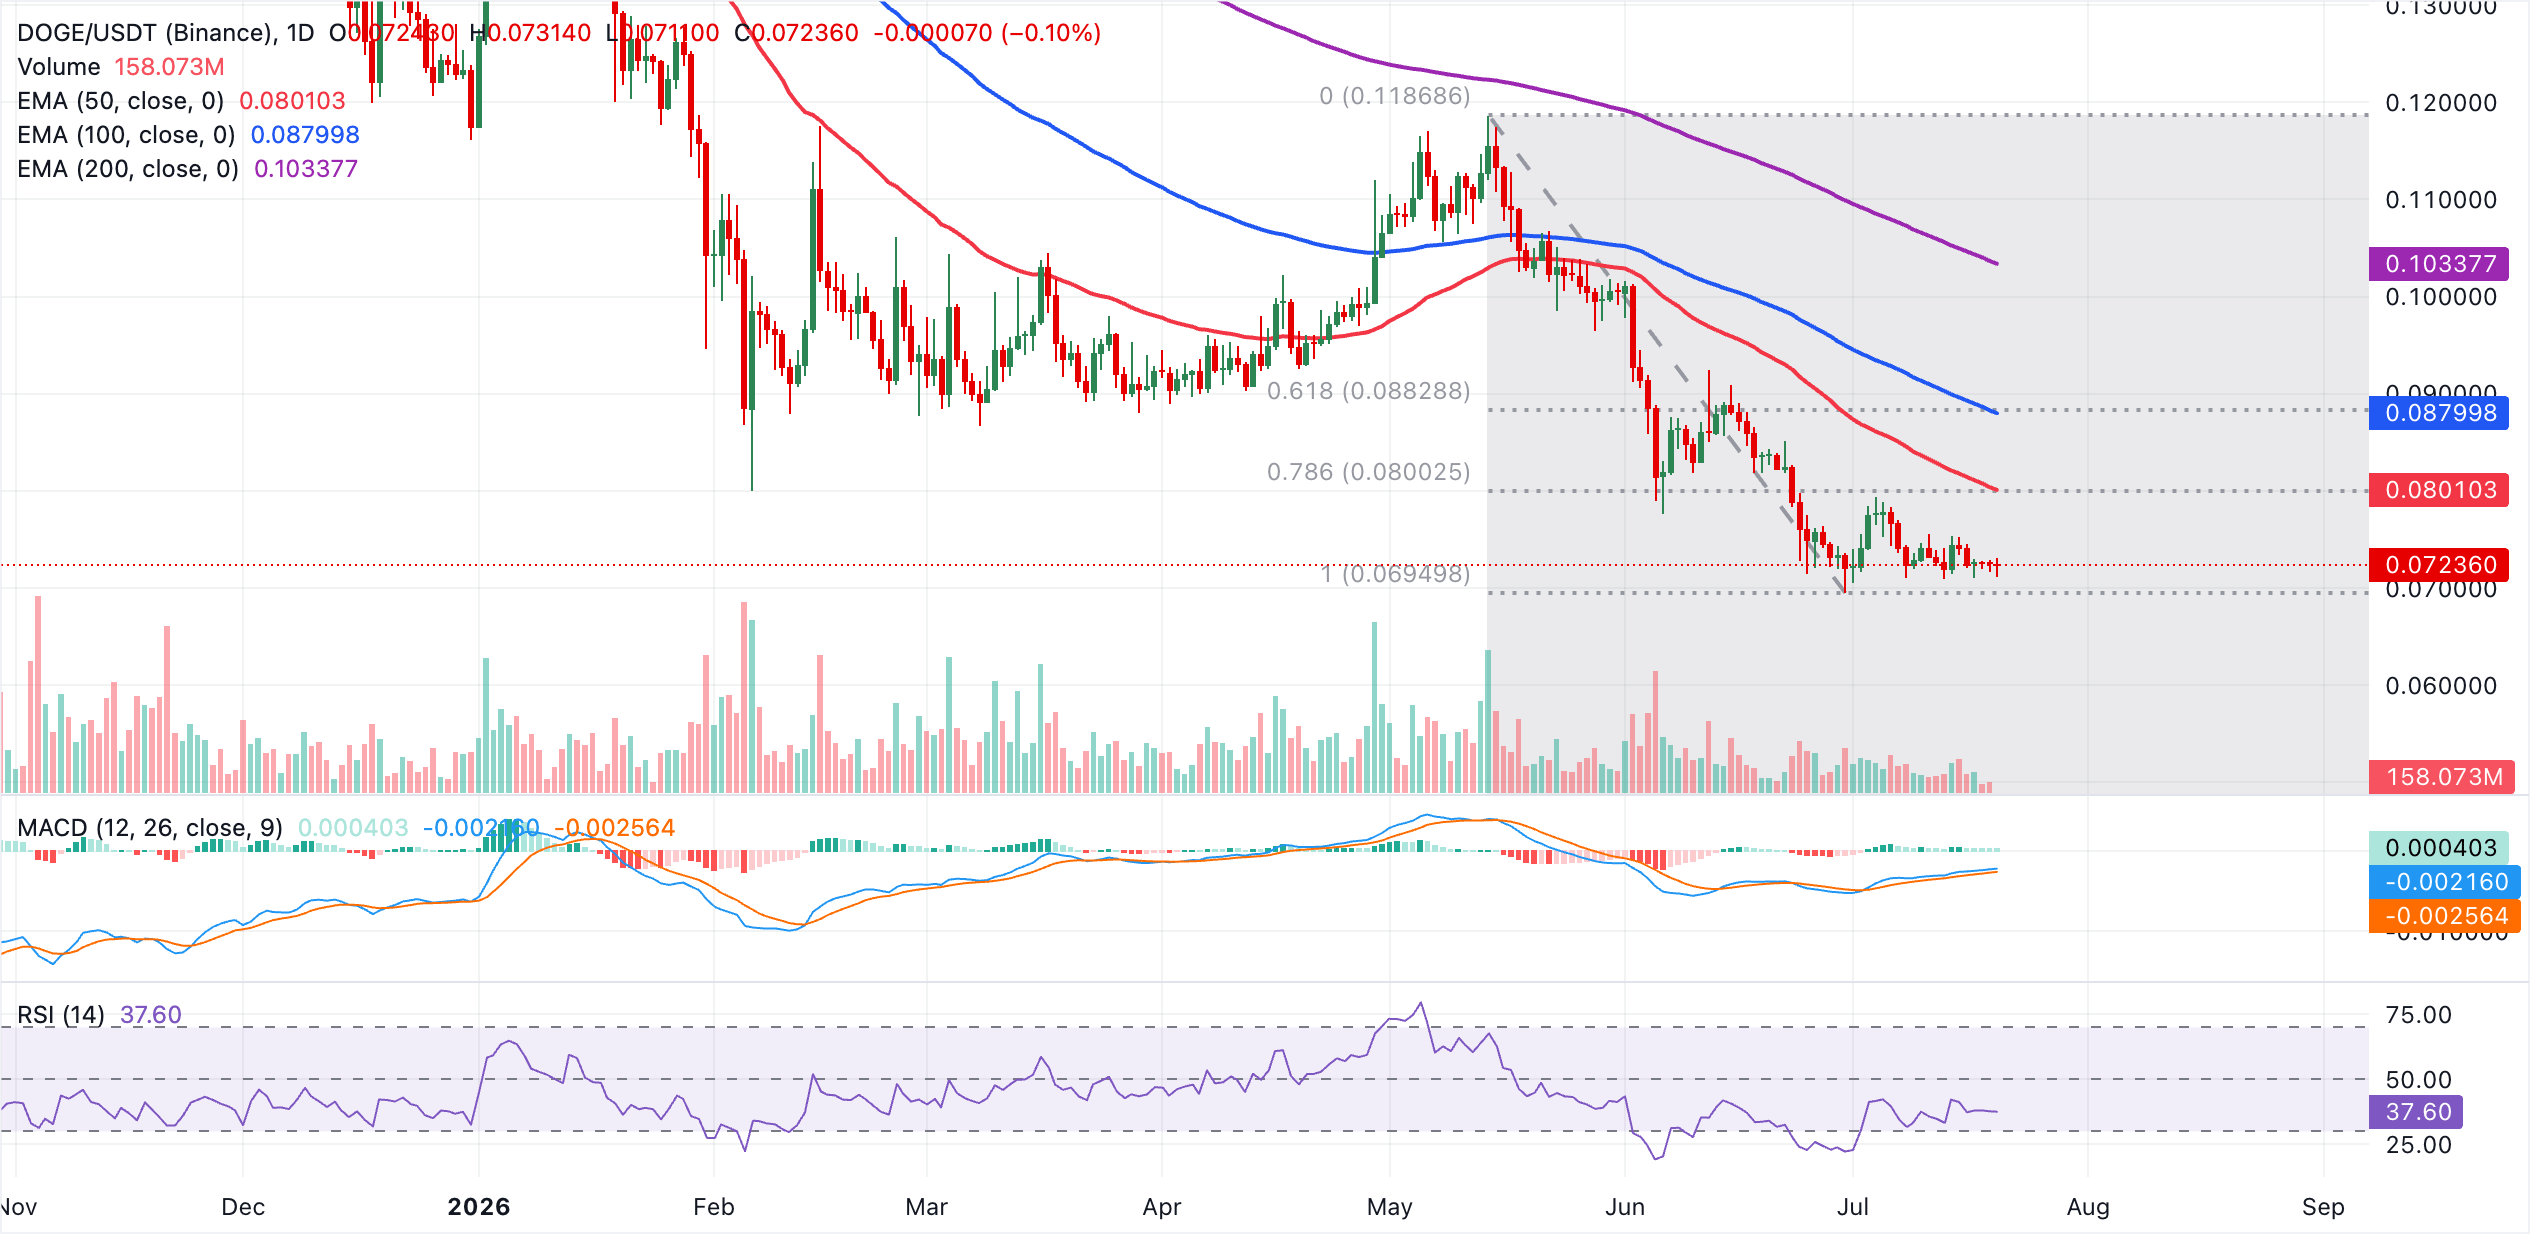
On the topside, initial resistance lies at the $0.080 cluster, followed by $0.090 where the 100-day EMA aligns with the 61.8% Fibonacci retracement. Above that, the 50% Fibonacci retracement at roughly $0.090 and the 38.2% level near $0.100. On the downside, immediate support emerges at the 100% Fibonacci retracement around $0.070. A clear break below this floor would expose the pair to a fresh leg lower in line with the prevailing bearish bias.
Shiba Inu price analysis: SHIB posts modest gains
Shiba Inu edges higher, trading around $0.0000040, upholding a short-term bullish outlook. The MACD indicator maintains a positive histogram, suggesting that momentum is constructive.
Moreover, the meme coin sits above a descending trendline on the daily chart, reinforcing downside protection while raising the odds of a continued rebound.
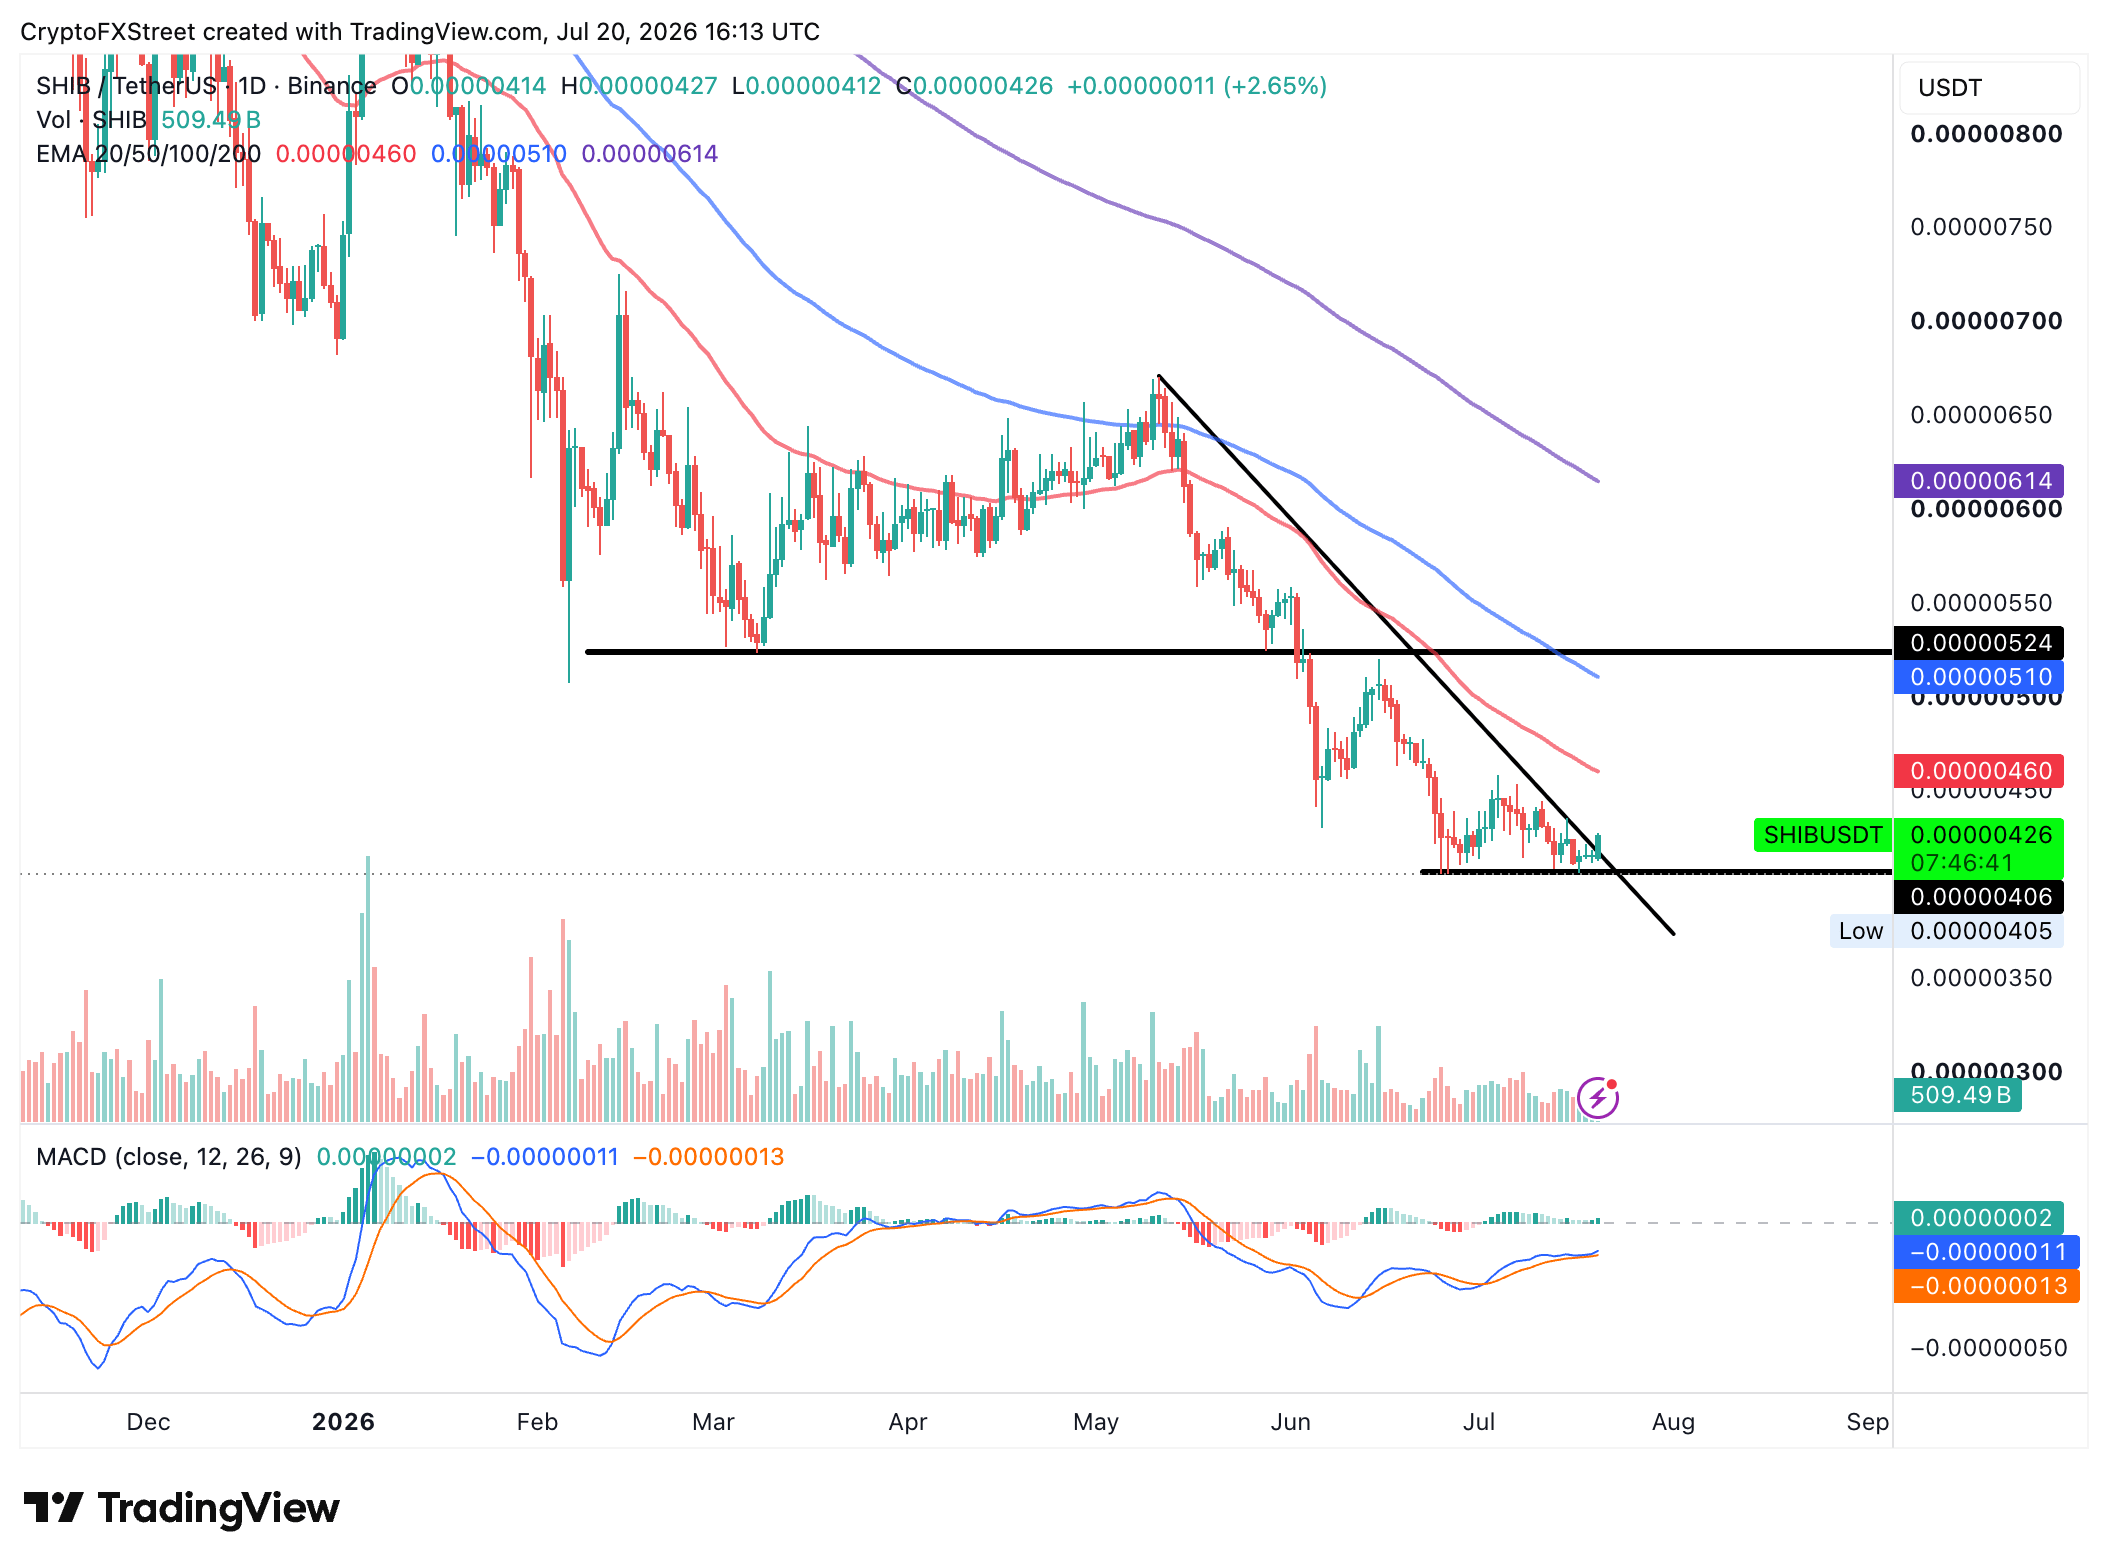
Initial resistance emerges at the 50-day EMA at $0.0000046, followed by the 100-day EMA at $0.0000051, while the 200-day EMA at $0.0000061 could cap gains if buyers tighten their grip. On the downside, the area at $0.0000040 is a crucial support level. If broken, it could open the door to extended losses toward the psychological $0.0000035.
(The technical analysis of this story was written with the help of an AI tool. Know more.)
Bitcoin, altcoins, stablecoins FAQs
Bitcoin is the largest cryptocurrency by market capitalization, a virtual currency designed to serve as money. This form of payment cannot be controlled by any one person, group, or entity, which eliminates the need for third-party participation during financial transactions.
Altcoins are any cryptocurrency apart from Bitcoin, but some also regard Ethereum as a non-altcoin because it is from these two cryptocurrencies that forking happens. If this is true, then Litecoin is the first altcoin, forked from the Bitcoin protocol and, therefore, an “improved” version of it.
Stablecoins are cryptocurrencies designed to have a stable price, with their value backed by a reserve of the asset it represents. To achieve this, the value of any one stablecoin is pegged to a commodity or financial instrument, such as the US Dollar (USD), with its supply regulated by an algorithm or demand. The main goal of stablecoins is to provide an on/off-ramp for investors willing to trade and invest in cryptocurrencies. Stablecoins also allow investors to store value since cryptocurrencies, in general, are subject to volatility.
Bitcoin dominance is the ratio of Bitcoin's market capitalization to the total market capitalization of all cryptocurrencies combined. It provides a clear picture of Bitcoin’s interest among investors. A high BTC dominance typically happens before and during a bull run, in which investors resort to investing in relatively stable and high market capitalization cryptocurrency like Bitcoin. A drop in BTC dominance usually means that investors are moving their capital and/or profits to altcoins in a quest for higher returns, which usually triggers an explosion of altcoin rallies.














