
NZD/USD Price Forecast: Extends gains past 0.5850, hinting at a trend shift
Bởi Guillermo Alcala
Đã cập nhật: 15 Jun 2026


BÀI VIẾT PHỔ BIẾN

The New Zealand Dollar (NZD) resumes its immediate bullish trend and appreciates against the US Dollar on Monday. The NZD/USD pair trades near 10-day highs above 0.5850 at the time of writing, fuelled by an improved market sentiment, following a peace deal between the US and Iran.
- NZD/USD rallies to 10-day highs past 0.5850 amid a renewed risk appetite.
- A peace agreement between the US and Iran has boosted investors' optimism.
- Technically, the pair shows a bullish Head & Shoulders pattern.
The New Zealand Dollar (NZD) resumes its immediate bullish trend and appreciates against the US Dollar on Monday. The NZD/USD pair trades near 10-day highs above 0.5850 at the time of writing, fuelled by an improved market sentiment, following a peace deal between the US and Iran.
Oil prices and the safe-haven US Dollar are tumbling at the start of the week, as investors celebrate the agreement on a memorandum of understanding to end hostilities and reopen the Strait of Hormuz. US President Trump said that the agreement might be signed on Friday in Switzerland, while the critical issue of Iran’s nuclear programme seems to have been left for later.
On the macroeconomic front, the only event worth mentioning on Monday is the US Industrial Production. The highlight of the week will be the Federal Reserve (Fed) monetary policy decision, due on Wednesday. The Fed is widely expected to leave interest rates on hold, but the bank’s statement will be analysed with particular attention to assess the impact of the new chairman, Kevin Warsh, and the end of the war in Iran.
Technical Analysis: Above the neckline of a bullish Head & Shoulders pattern
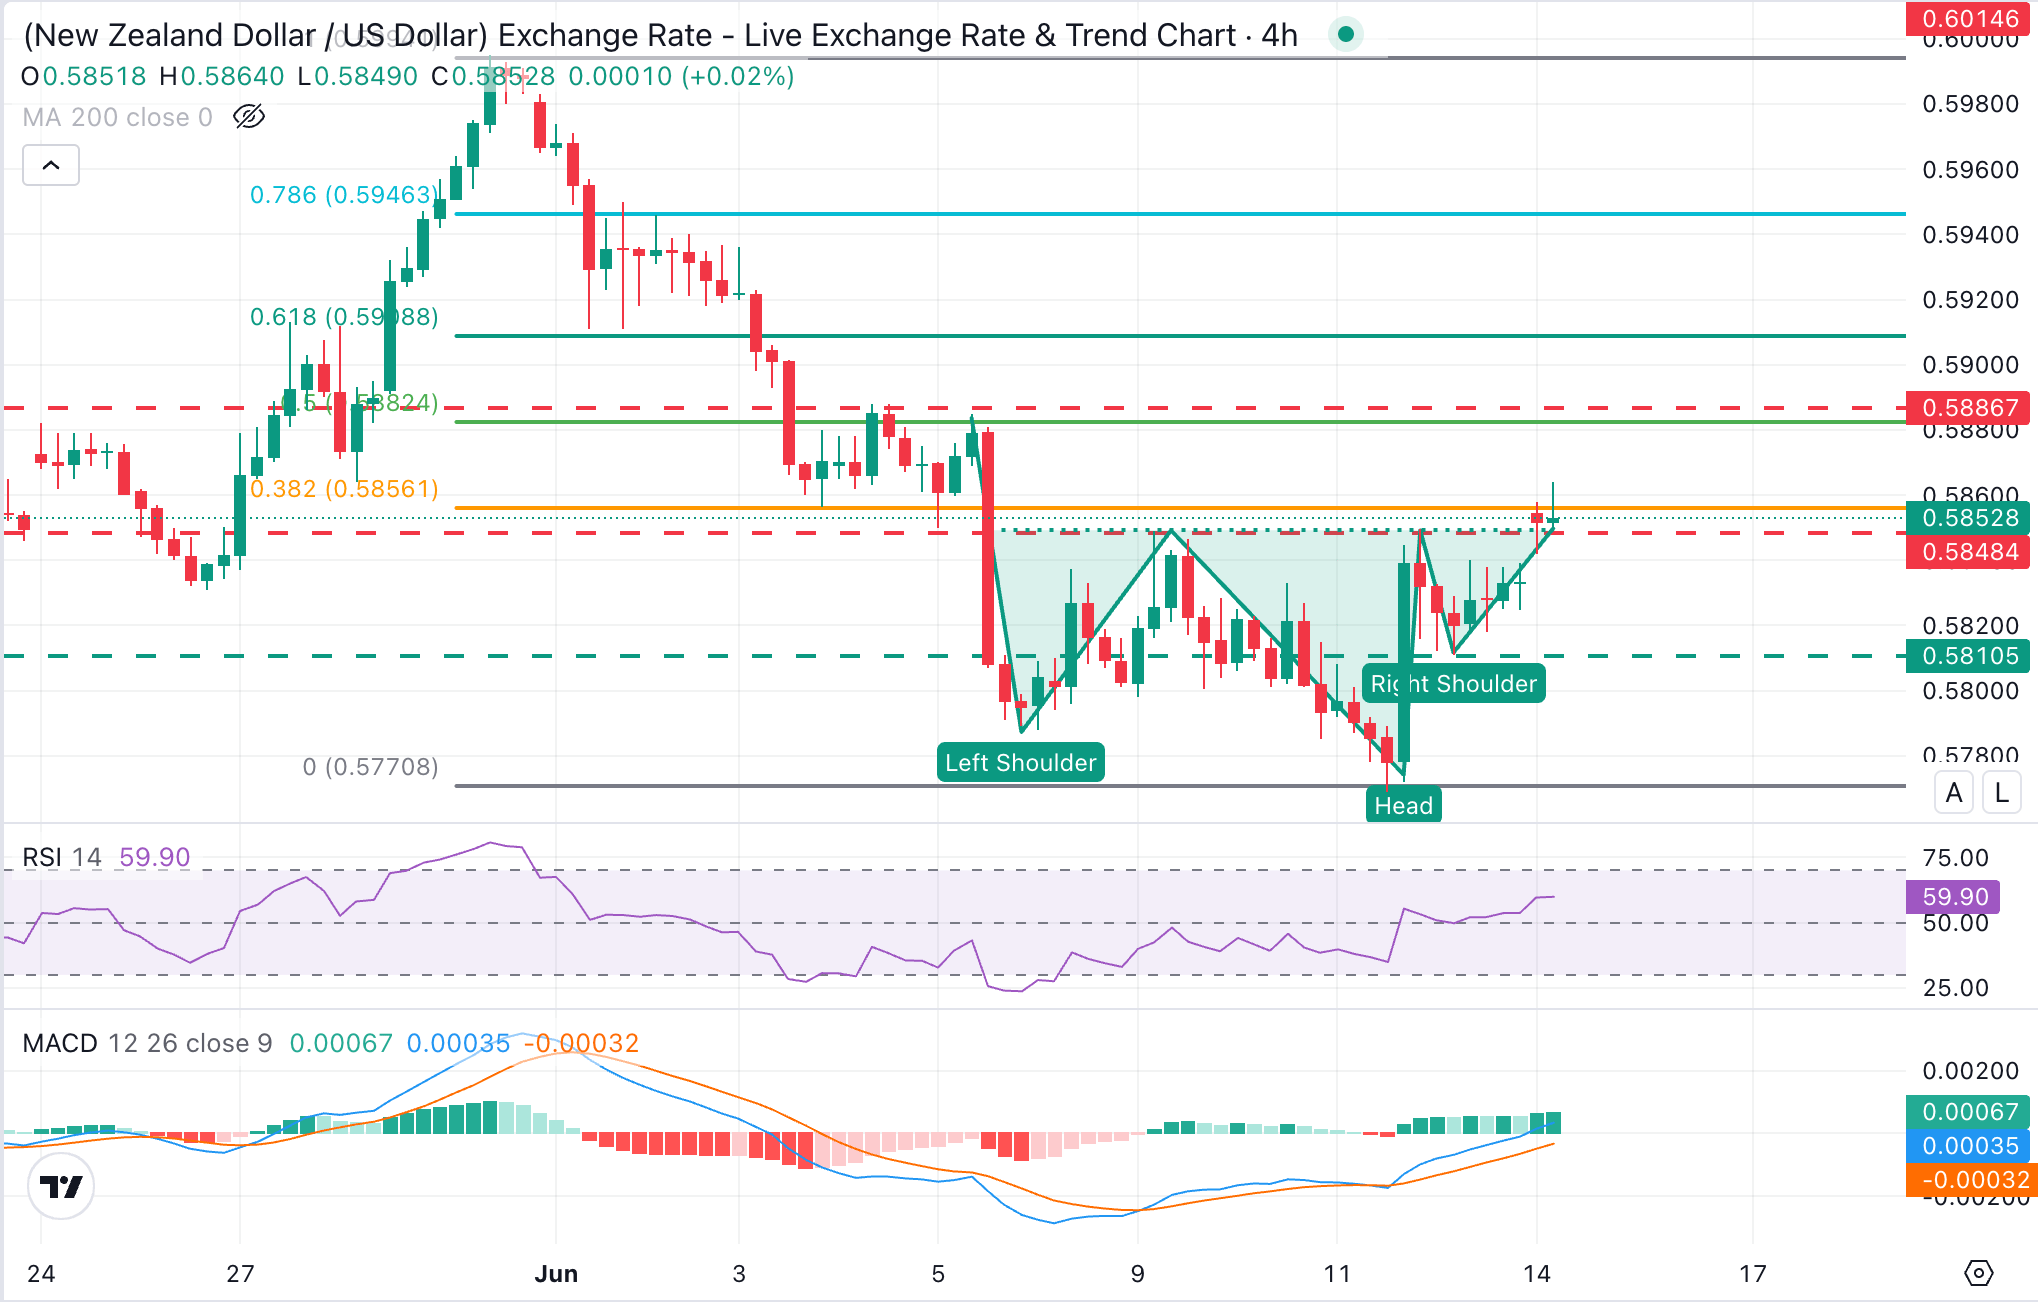
NZD/USD trades at 0.5852, holding a mildly bullish near-term bias as it clings above the neckline of an inverted Head & Shoulders (H&S) pattern, a common figure to anticipate trend shifts. The Relative Strength Index (RSI) in the 4-hour chart hovers in near 60, while the Moving Average Convergence Divergence (MACD) line remains above its signal line in positive territory, which suggests building upside momentum.
Bulls are now hesitating at the 38.2% Fibonacci retracement of the early-June selloff, at 0.5857. Above here, the next upside target is the June 4 and 5 highs, at the 0.5890 area and the 61.8% Fibonacci retracement of the mentioned cycle, at 0.5910.
Downside attempts, on the contrary, remain supported above the H&S's neckline, at the 0.5845 area so far. Further down, Friday's low, near 0.5810, and Thursday's low, at the 0.5760 area, would be the next targets.
(The technical analysis of this story was written with the help of an AI tool.)
US Dollar Price Today
The table below shows the percentage change of US Dollar (USD) against listed major currencies today. US Dollar was the strongest against the Japanese Yen.
| USD | EUR | GBP | JPY | CAD | AUD | NZD | CHF | |
|---|---|---|---|---|---|---|---|---|
| USD | -0.34% | -0.27% | -0.06% | -0.13% | -0.38% | -0.28% | -0.33% | |
| EUR | 0.34% | 0.06% | 0.32% | 0.26% | -0.05% | 0.07% | -0.01% | |
| GBP | 0.27% | -0.06% | 0.24% | 0.16% | -0.15% | 0.02% | -0.08% | |
| JPY | 0.06% | -0.32% | -0.24% | -0.05% | -0.33% | -0.25% | -0.30% | |
| CAD | 0.13% | -0.26% | -0.16% | 0.05% | -0.25% | -0.18% | -0.24% | |
| AUD | 0.38% | 0.05% | 0.15% | 0.33% | 0.25% | 0.12% | 0.07% | |
| NZD | 0.28% | -0.07% | -0.02% | 0.25% | 0.18% | -0.12% | -0.08% | |
| CHF | 0.33% | 0.00% | 0.08% | 0.30% | 0.24% | -0.07% | 0.08% |
The heat map shows percentage changes of major currencies against each other. The base currency is picked from the left column, while the quote currency is picked from the top row. For example, if you pick the US Dollar from the left column and move along the horizontal line to the Japanese Yen, the percentage change displayed in the box will represent USD (base)/JPY (quote).

Hơn một triệu người dùng dựa vào FXStreet để có dữ liệu thị trường thời gian thực, công cụ biểu đồ, góc nhìn chuyên gia và tin tức Forex. Lịch kinh tế toàn diện và các hội thảo web giáo dục giúp nhà giao dịch luôn cập nhật và đưa ra quyết định có tính toán. FXStreet có khoảng 60 nhân sự, chia giữa trụ sở Barcelona và nhiều khu vực toàn cầu.
Đọc thêm


