

Pi Network Price Forecast: Selling pressure builds despite vibe coding on Pi ecosystem
- Pi Network extends losses on Friday as a 50-period EMA caps short-term recovery attempts.
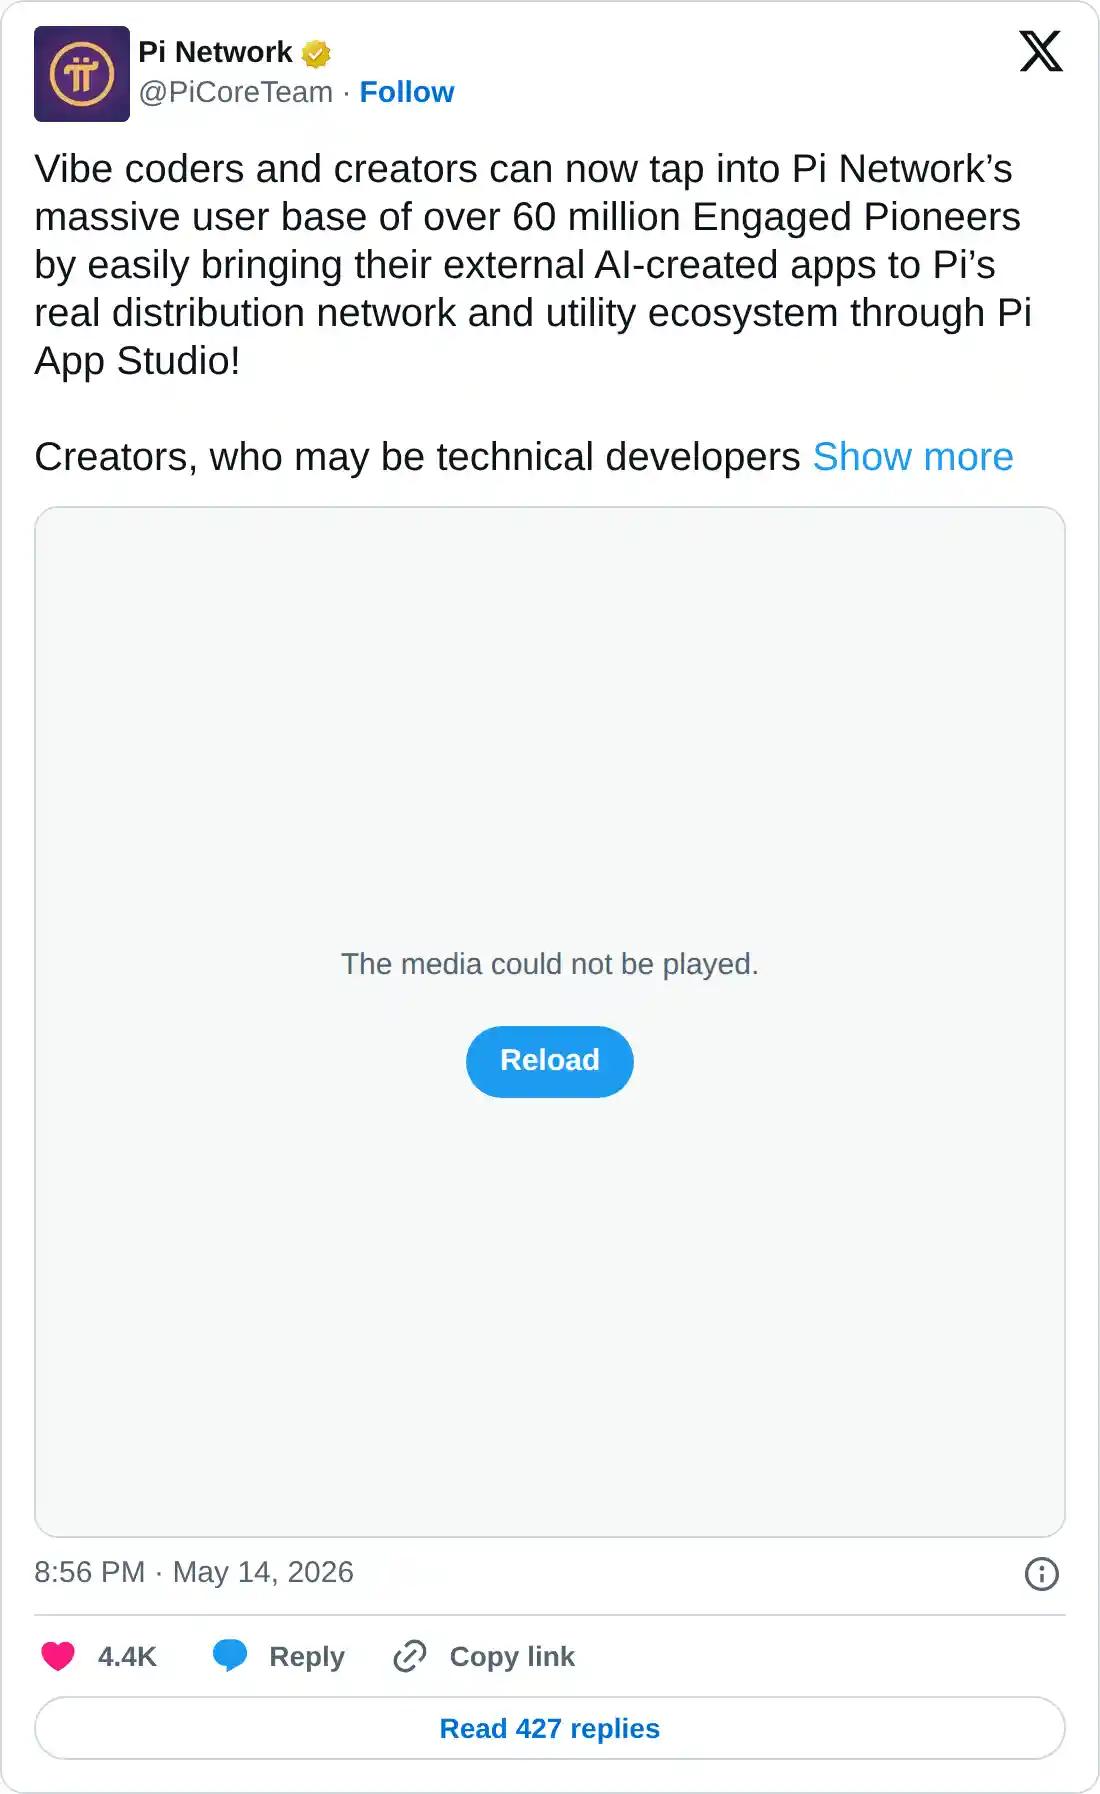
- Pi App Studio enables creators to import AI-generated apps and convert them into Pi Apps for ecosystem access.
- The technical outlook for PI is bearish, with a risk of a steeper decline below $0.1700.
Pi Network (PI) extends losses at press time on Friday, risking a bearish breakout from a short-term consolidation range on the 4-hour chart. Pi Network remains under pressure from the 50-period Exponential Moving Average (EMA) at $0.1733, which caps short-term recovery despite the launch of vibe coding features in the Pi ecosystem.

Pi Network enables vibe coding features to boost ecosystem development
Pi Network has rolled out new vibe coding features for its developers, allowing the conversion of AI-generated apps from Codex, Claude Code, Replit, Cursor, Lovable, or other AI-assisted coding tools into Pi Apps. The AI assistance could significantly reduce the time required for app development and boost the ecosystem that has over 60 million engaged users.
Will the PI token price extend its correction?
Pi Network is under a corrective bias, capped by the 50-period EMA at $0.1733 on the 4-hour chart and the 200-period EMA at $0.1771. The pair also sits below a nearby downtrend resistance line around $0.1741, reinforcing the upside barrier.
The Relative Strength Index (RSI) at 45 reverses below the midline, suggesting persistent selling pressure and a near-flat Moving Average Convergence Divergence (MACD) reading, hinting at weak, consolidative momentum rather than a decisive reversal higher.
On the downside, structural support is seen much lower at the long-term descending trendline, close to the S1 Pivot Point at $0.1645.
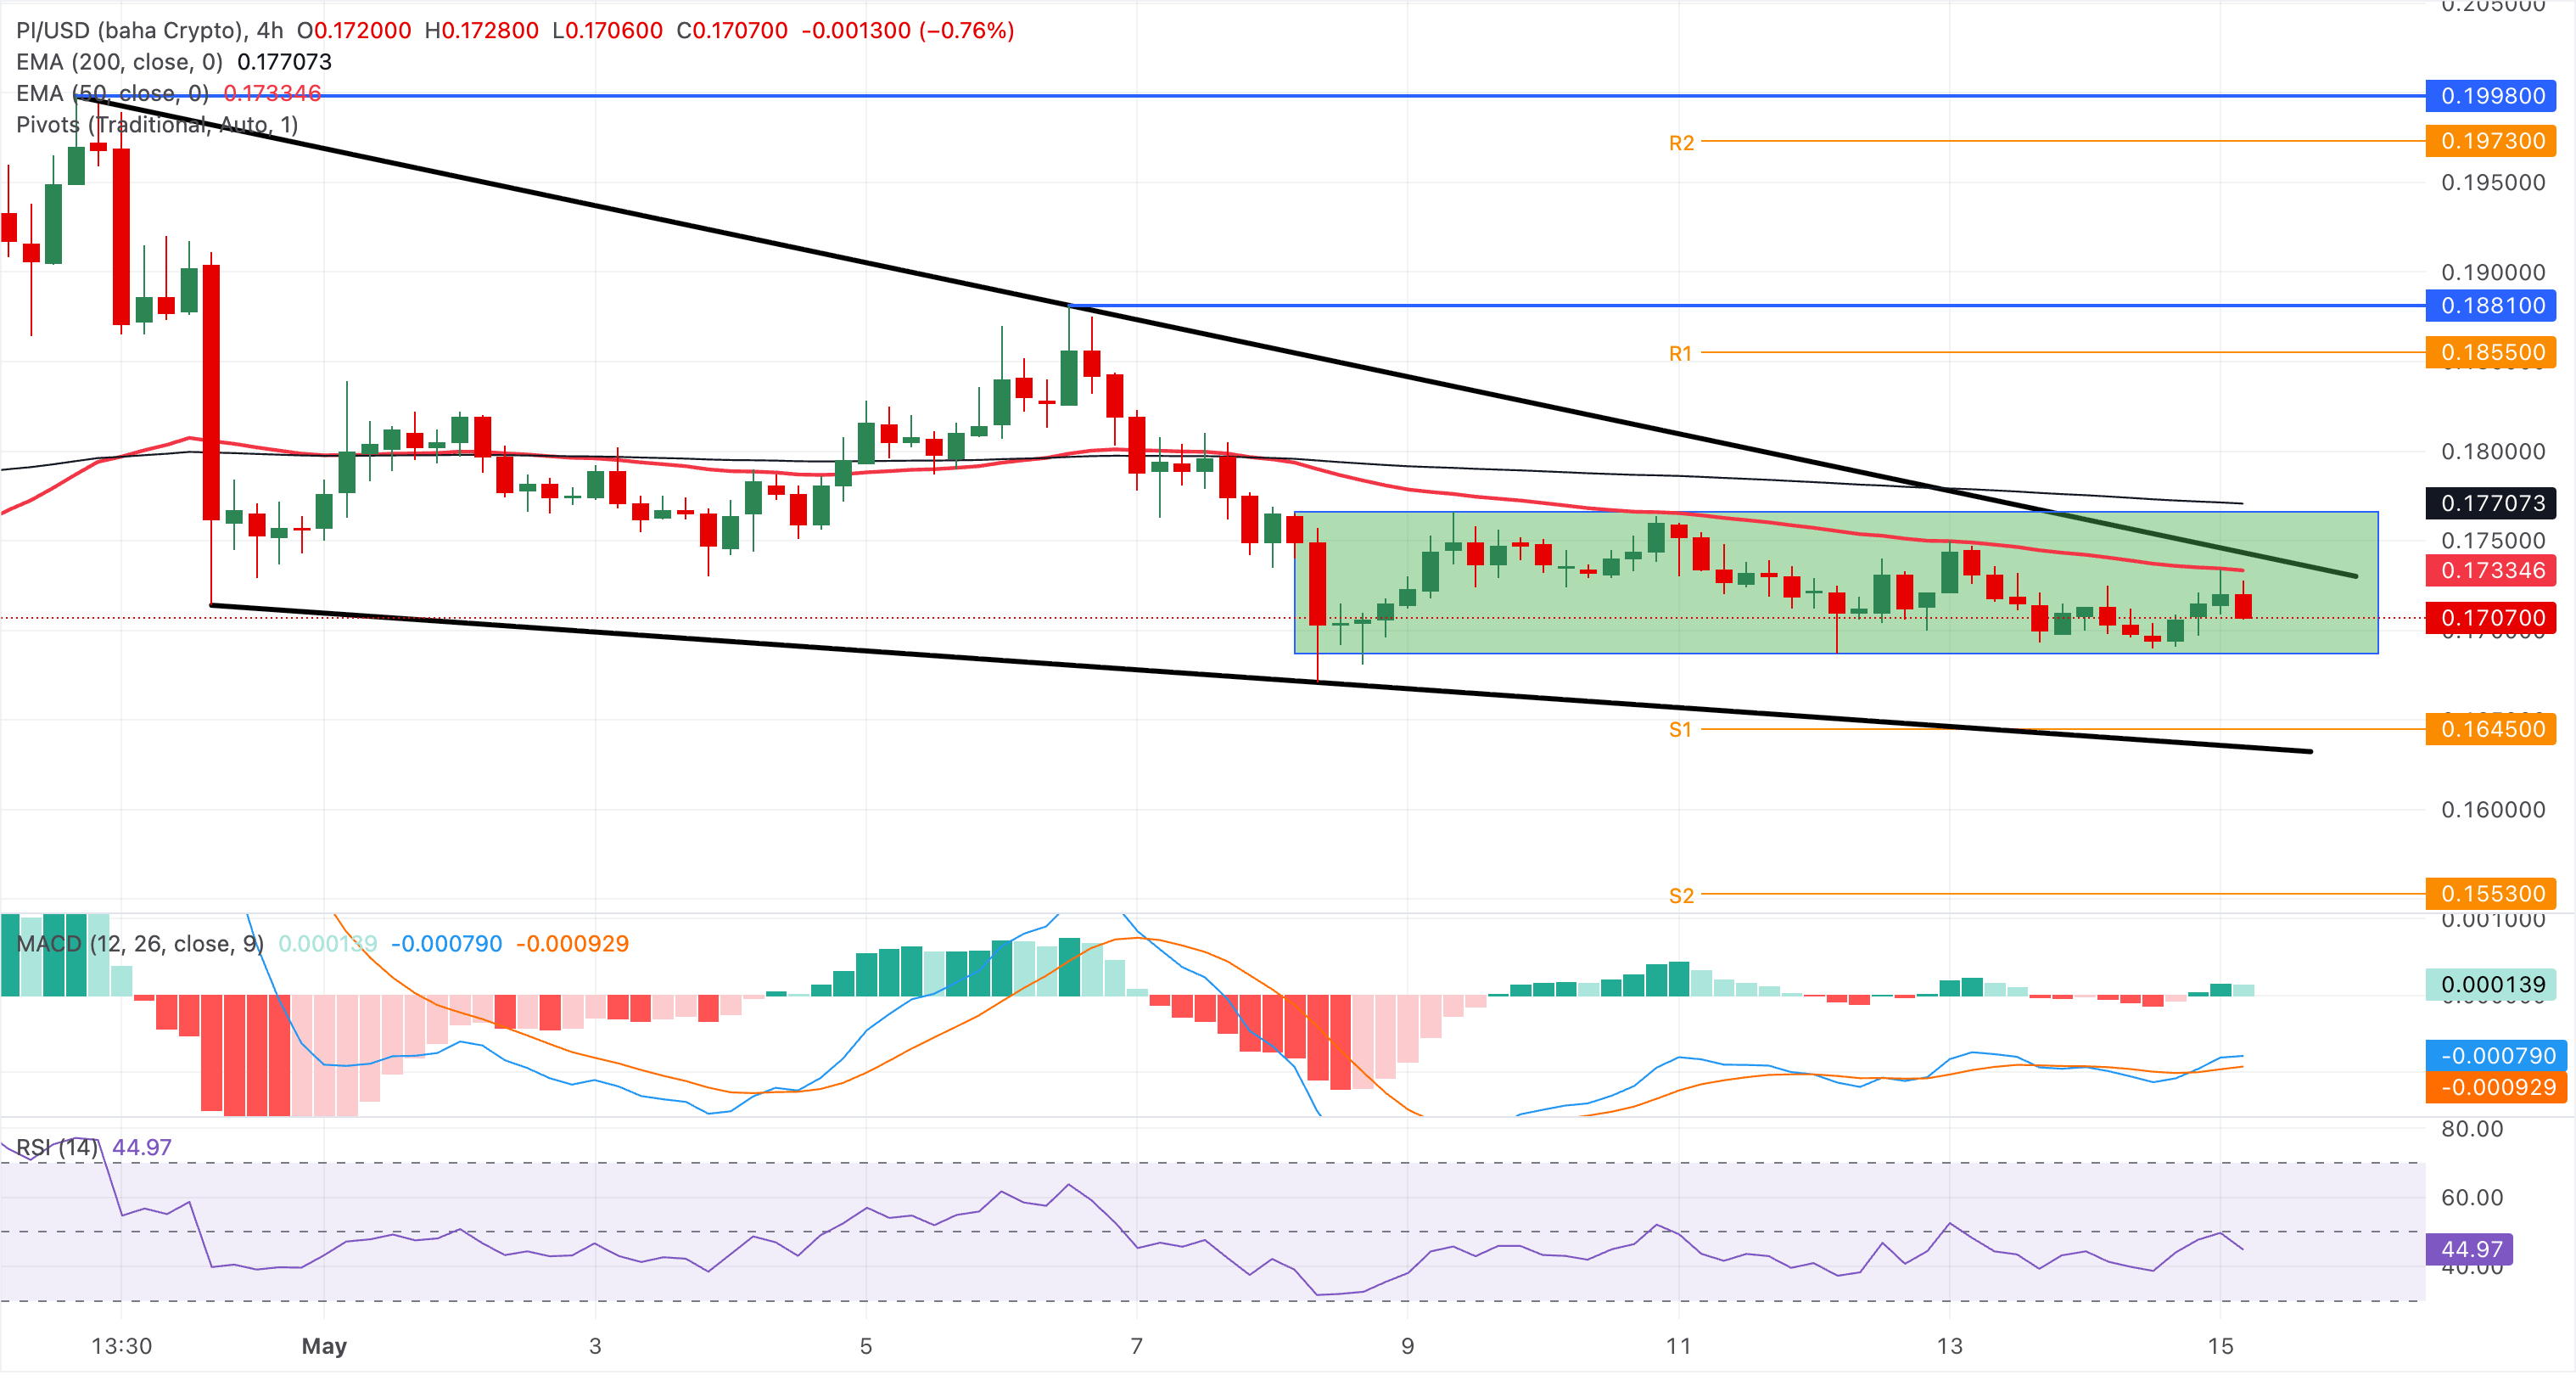
On the topside, immediate resistance is at the 50-period EMA near $0.1733, followed by the descending trendline barrier around $0.1741; a sustained break above these would expose the 200-period EMA at $0.1771 and then the prior rising trendline break level near $0.1824.
(The technical analysis of this story was written with the help of an AI tool.)














