
Silver Price Forecast: XAG/USD declines to near $58.60 as US-Iran attacks renew energy supply concerns
Bởi Sagar Dua
Đã cập nhật: 29 Jun 2026


BÀI VIẾT PHỔ BIẾN

Silver price (XAG/USD) trades almost 1% lower at around $58.60 during the European trading session on Monday. The white metal is under pressure as trade of attacks between the United States (US) and Iran has renewed fears of energy flow disruption, a scenario that could boost oil prices.
- Silver price declines to near $58.60 due to renewed fears of global energy supply disruption.
- Iran’s Foreign Minister Araghchi said that responsibility for the Strait of Hormuz lies solely with Tehran.
- Investors await the US NFP data, which will be released on Thursday.
Silver price (XAG/USD) trades almost 1% lower at around $58.60 during the European trading session on Monday. The white metal is under pressure as trade of attacks between the United States (US) and Iran has renewed fears of energy flow disruption, a scenario that could boost oil prices.
Over the weekend, there was an exchange of attacks between the US and Iran near the Strait of Hormuz, a vital passage to almost 20% of global energy supply, which appeared to be a display of aggression by Tehran for not recognizing its authority near the chokepoint.
Iran’s Foreign Minister Abbas Araghchi said that responsibility for the Strait of Hormuz lies solely with Tehran and warned that any attempt to bypass its preferred route in the waterway will cause “tension and escalation”, AlJazeera reported. However, later both nations agreed to a ceasefire and for talks in Omar on Tuesday.
Since the onset of the Middle East war, the Silver price has underperformed as higher oil prices prompted inflationary pressures globally.
Meanwhile, investors await the US Nonfarm Payrolls (NFP) data for June, which will be released on Thursday. Investors will closely track the data to get fresh cues regarding the Federal Reserve’s (Fed) monetary policy outlook.
Silver technical analysis
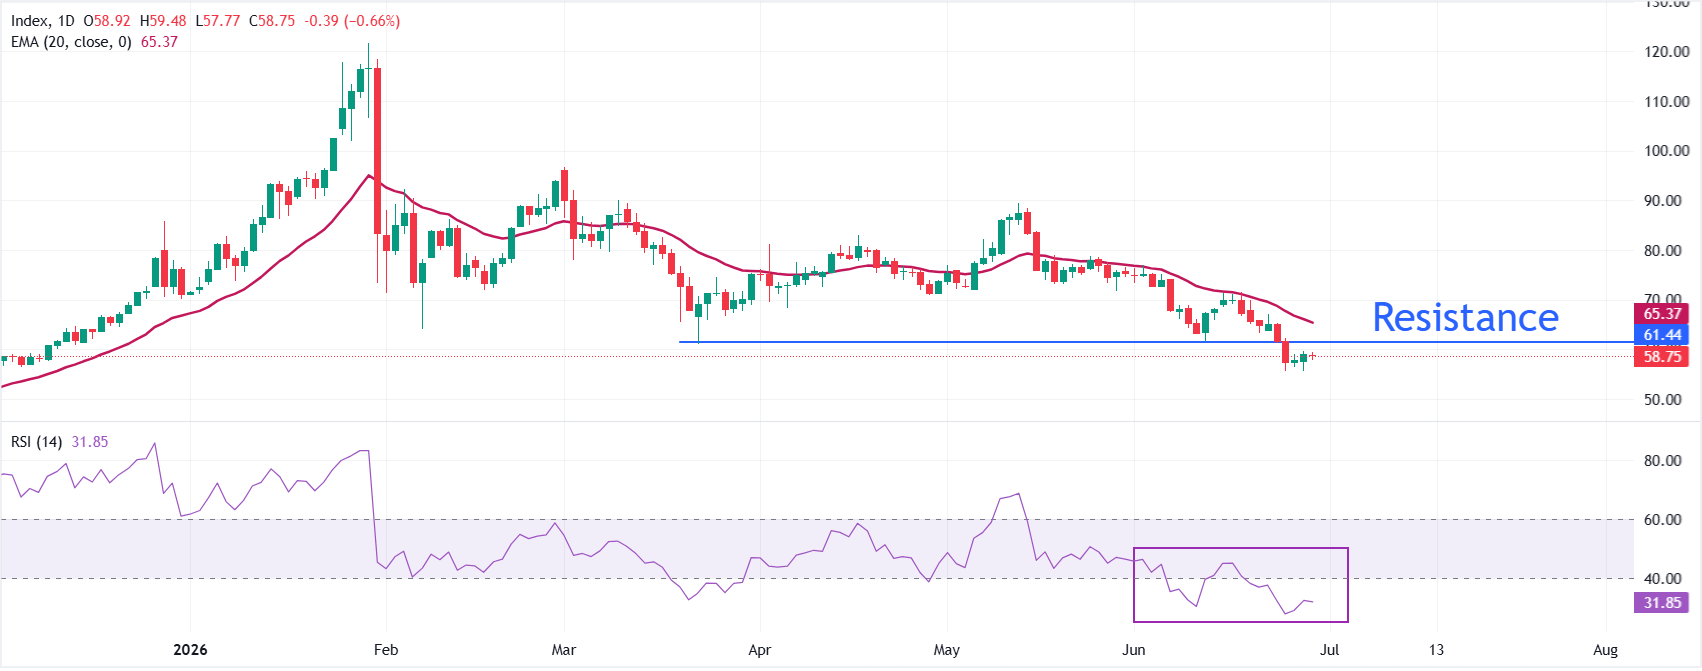
XAG/USD trades lower at around $58.60, retaining a bearish near-term bias as it remains well under the 20-day exponential moving average (EMA) at $65.37. The distance to this overhead EMA resistance hints that rebounds would likely be corrective within a broader downtrend, while the Relative Strength Index (RSI) at 31.85 hovers just above oversold territory, suggesting downside momentum is still dominant but could be nearing exhaustion.
On the topside, the March 23 low at $61.01 is the first meaningful resistance, followed by the 20-day EMA at $65.37. On the downside, the Silver price could extend its decline towards the psychological level of $50 if it falls below the June 24 low of $55.63.
(The technical analysis of this story was written with the help of an AI tool.)
Silver FAQs
Silver is a precious metal highly traded among investors. It has been historically used as a store of value and a medium of exchange. Although less popular than Gold, traders may turn to Silver to diversify their investment portfolio, for its intrinsic value or as a potential hedge during high-inflation periods. Investors can buy physical Silver, in coins or in bars, or trade it through vehicles such as Exchange Traded Funds, which track its price on international markets.
Silver prices can move due to a wide range of factors. Geopolitical instability or fears of a deep recession can make Silver price escalate due to its safe-haven status, although to a lesser extent than Gold's. As a yieldless asset, Silver tends to rise with lower interest rates. Its moves also depend on how the US Dollar (USD) behaves as the asset is priced in dollars (XAG/USD). A strong Dollar tends to keep the price of Silver at bay, whereas a weaker Dollar is likely to propel prices up. Other factors such as investment demand, mining supply – Silver is much more abundant than Gold – and recycling rates can also affect prices.
Silver is widely used in industry, particularly in sectors such as electronics or solar energy, as it has one of the highest electric conductivity of all metals – more than Copper and Gold. A surge in demand can increase prices, while a decline tends to lower them. Dynamics in the US, Chinese and Indian economies can also contribute to price swings: for the US and particularly China, their big industrial sectors use Silver in various processes; in India, consumers’ demand for the precious metal for jewellery also plays a key role in setting prices.
Silver prices tend to follow Gold's moves. When Gold prices rise, Silver typically follows suit, as their status as safe-haven assets is similar. The Gold/Silver ratio, which shows the number of ounces of Silver needed to equal the value of one ounce of Gold, may help to determine the relative valuation between both metals. Some investors may consider a high ratio as an indicator that Silver is undervalued, or Gold is overvalued. On the contrary, a low ratio might suggest that Gold is undervalued relative to Silver.

Hơn một triệu người dùng dựa vào FXStreet để có dữ liệu thị trường thời gian thực, công cụ biểu đồ, góc nhìn chuyên gia và tin tức Forex. Lịch kinh tế toàn diện và các hội thảo web giáo dục giúp nhà giao dịch luôn cập nhật và đưa ra quyết định có tính toán. FXStreet có khoảng 60 nhân sự, chia giữa trụ sở Barcelona và nhiều khu vực toàn cầu.
Đọc thêm


