

US S&P Global PMI expected to show steady business growth in July
- The S&P Global flash PMIs for July are expected to show stable business expansion.
- Investors will pay close attention to comments surrounding input costs.
- EUR/USD remains technically bearish in the near term.
S&P Global will release the July flash Purchasing Managers' Indices (PMIs) for the United States (US) on Friday. These surveys of top private-sector executives are seen as an early indicator of the country’s economic health.
Market participants anticipate the S&P Global Services PMI to decline slightly to 51.0 from 51.2 in June, while the S&P Global Manufacturing PMI is expected to edge higher to 54.5 from 53.9, with both prints remaining in the expansion territory above 50. In addition to headline PMI figures, the surveys also include comments on employment and input inflation, which could influence the US Dollar’s (USD) valuation.

What can we expect from the next S&P Global PMI report?
While PMI surveys are forecast to reaffirm healthy business conditions in the private sector, details surrounding input costs could ramp up market volatility. Although the softer-than-expected June inflation data from the US eased bets for a Federal Reserve (Fed) interest rate hike in July, the recent increase in Oil prices caused investors to refrain from pricing in a prolonged policy hold.
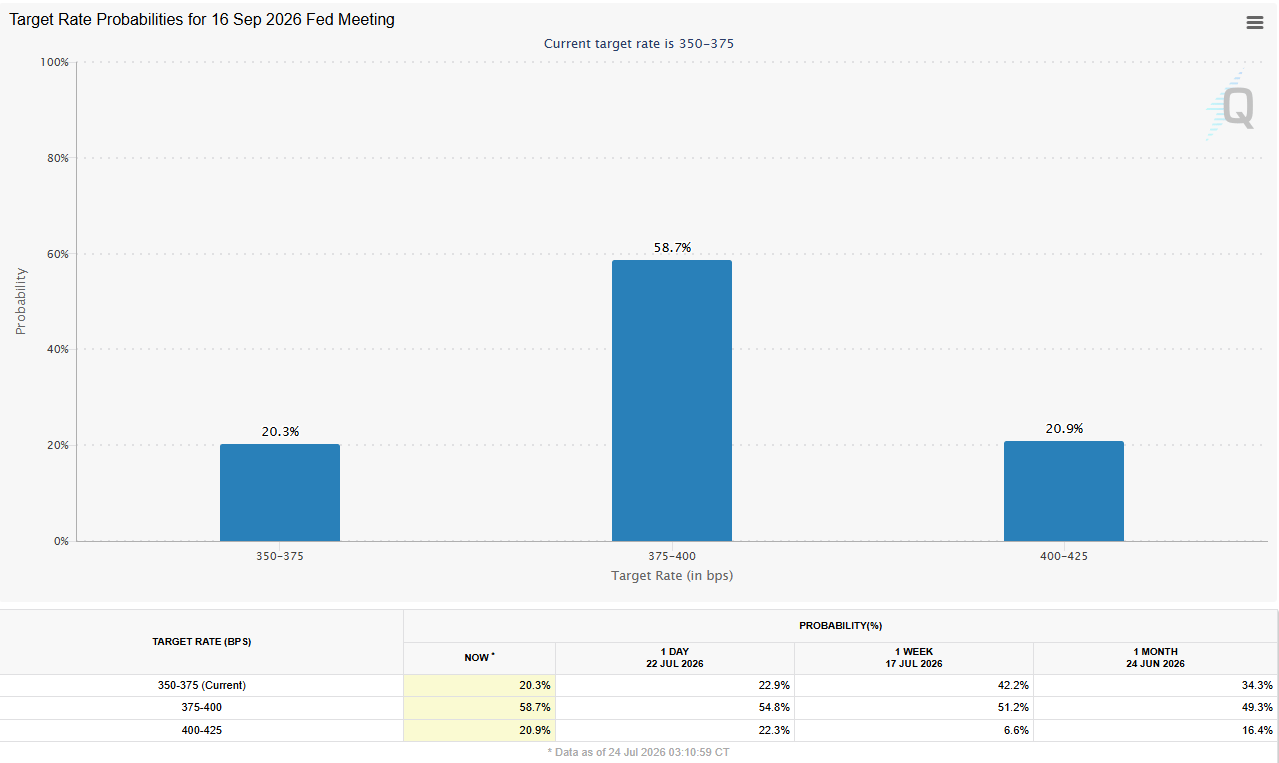
With the US and Iran ramping up military aggression in the Middle East, the barrel of West Texas Intermediate (WTI) is up nearly 30% in July. In the meantime, the CME FedWatch Tool shows that markets are pricing in a nearly 80% probability of an at least 25 basis points (bps) Fed rate hike by September.
Previewing the PMI data, “we expect both the S&P manufacturing and services PMIs to improve in July. Manufacturing is likely to rebound to 54.5, in line with strong regional surveys in the month (Empire and Philly Fed),” TD Securities analysts said.
“Meanwhile, services is likely to continue improving to 51.5. NY Fed services improved in July, and we expect S&P to begin catching up to ISM,” they added.
When will the June flash US S&P Global PMIs be released and how could they affect EUR/USD?
The S&P Global Manufacturing, Services, and Composite PMIs reports will be released at 13:45 GMT on Friday. As previously noted, they are expected to show that US business activity continued to expand in July.
In case the publication suggests that business owners are facing increasing input costs in July and considering transferring those costs to customers by raising prices, markets could see that as a sign of inflationary pressures resurfacing again in July. In this scenario, the USD could continue to gather strength heading into the weekend and weigh on EUR/USD.
Conversely, an unexpected drop into the contraction territory below 50, in either the headline Manufacturing or the Services PMI, could hurt the USD with the immediate reaction and help EUR/USD hold its ground.
Middle East tensions risk being underplayed in early July PMI signals
Analysts at Rabobank caution that the initial July PMI signals may not fully capture the latest geopolitical and commodity-market developments. They argue that “this preliminary reading may understate the impact of the escalation in the Middle East,” noting that “the July poll was probably conducted in the past two weeks, so the results may be skewed if many respondents replied early – and therefore could not fully factor in the current situation in the Middle East, or this week’s increase in oil prices.”
Eren Sengezer, European Session Lead Analyst, shares a brief technical outlook for EUR/USD:
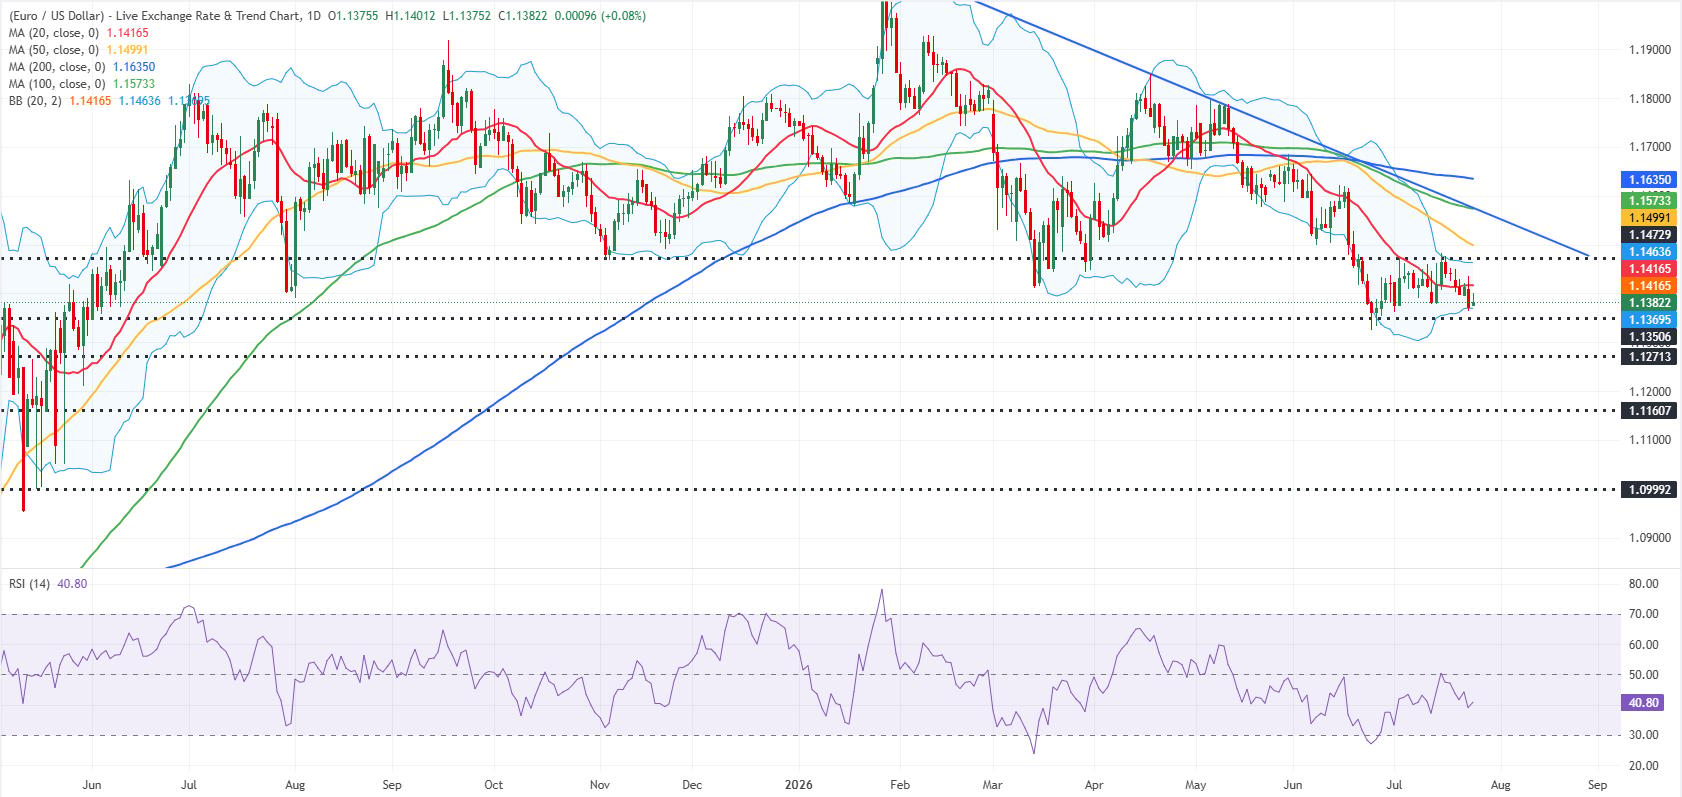
“EUR/USD trades below the 20-day Simple Moving Average (SMA) following multiple failed attempts to clear that level earlier in the week. Additionally, the Relative Strength Index (RSI) indicator on the daily chart stays near 40, reaffirming the bearish stance.”
“On the downside, 1.1370-1.1350 (Bollinger Band lower arm, static level) aligns as the first support area ahead of 1.1270 (static level) and 1.1160 (static level). Looking north, the immediate resistance level could be spotted at 1.1420 (20-day SMA), followed by 1.1470 (Bollinger Band upper arm) and 1.1570 (100-day SMA).”
Inflation FAQs
Inflation measures the rise in the price of a representative basket of goods and services. Headline inflation is usually expressed as a percentage change on a month-on-month (MoM) and year-on-year (YoY) basis. Core inflation excludes more volatile elements such as food and fuel which can fluctuate because of geopolitical and seasonal factors. Core inflation is the figure economists focus on and is the level targeted by central banks, which are mandated to keep inflation at a manageable level, usually around 2%.
The Consumer Price Index (CPI) measures the change in prices of a basket of goods and services over a period of time. It is usually expressed as a percentage change on a month-on-month (MoM) and year-on-year (YoY) basis. Core CPI is the figure targeted by central banks as it excludes volatile food and fuel inputs. When Core CPI rises above 2% it usually results in higher interest rates and vice versa when it falls below 2%. Since higher interest rates are positive for a currency, higher inflation usually results in a stronger currency. The opposite is true when inflation falls.
Although it may seem counter-intuitive, high inflation in a country pushes up the value of its currency and vice versa for lower inflation. This is because the central bank will normally raise interest rates to combat the higher inflation, which attract more global capital inflows from investors looking for a lucrative place to park their money.
Formerly, Gold was the asset investors turned to in times of high inflation because it preserved its value, and whilst investors will often still buy Gold for its safe-haven properties in times of extreme market turmoil, this is not the case most of the time. This is because when inflation is high, central banks will put up interest rates to combat it. Higher interest rates are negative for Gold because they increase the opportunity-cost of holding Gold vis-a-vis an interest-bearing asset or placing the money in a cash deposit account. On the flipside, lower inflation tends to be positive for Gold as it brings interest rates down, making the bright metal a more viable investment alternative.














