
USD/CAD Price Forecast: Uptrend intact as bulls eye 1.4200
Bởi Christian Borjon Valencia
Đã cập nhật: 19 Jun 2026


BÀI VIẾT PHỔ BIẾN

The USD/CAD rises during the North American session, up by 0.27% on Friday and by over 1.34% in the week, with the pair staying upward biased and set to test higher prices seen last year. At the time of writing, the pair trades at 1.4175, after bouncing off daily lows of 1.4131.
- USD/CAD extends clear uptrend as bulls target 1.4200 resistance.
- RSI near extreme overbought levels warns of pullback risk.
- Break above 1.4200 exposes 1.4273 and 1.4415 targets.
The USD/CAD rises during the North American session, up by 0.27% on Friday and by over 1.34% in the week, with the pair staying upward biased and set to test higher prices seen last year. At the time of writing, the pair trades at 1.4175, after bouncing off daily lows of 1.4131.
USD/CAD Price Forecast: Technical outlook
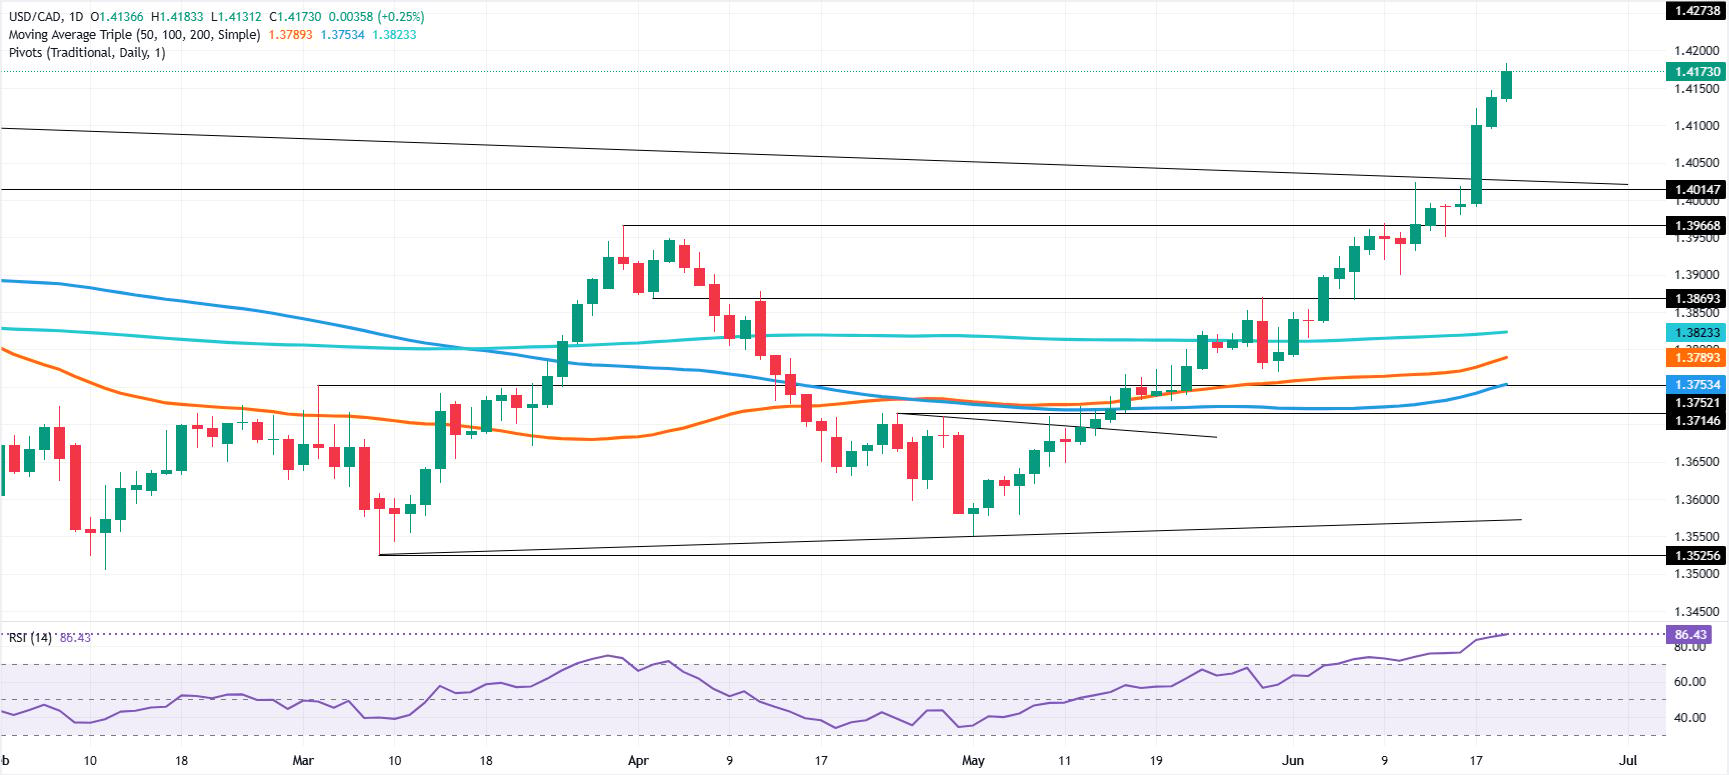
Price action shows a clear uptrend, with USD/CAD poised to test 1.4200 in the short term. Momentum is also extremely bullish, as depicted by the Relative Strength Index (RS), which is above the overbought level of 70 and near an extreme at 86.45, indicating the pair is subject to a pullback.
For a bullish continuation, the USD/CAD must clear 1.4200. A breach of the latter will expose April 9, 2025, at 1.4273, followed by April 1, 2025, at 1.4415.
On the flip side, if USD/CAD drops below 1.4150, sellers could test the psychological 1.4100 mark. Below this level is the June 11 daily high turned support at 1.4024, followed by the June 15 daily low of 1.3994. On further weakness, the next stop would be the June 10 swing low of 1.3899.
USD/CAD Price Chart – Daily
Canadian Dollar Price This week
The table below shows the percentage change of Canadian Dollar (CAD) against listed major currencies this week. Canadian Dollar was the strongest against the New Zealand Dollar.
| USD | EUR | GBP | JPY | CAD | AUD | NZD | CHF | |
|---|---|---|---|---|---|---|---|---|
| USD | 0.86% | 1.33% | 0.69% | 1.30% | 0.45% | 1.52% | 1.29% | |
| EUR | -0.86% | 0.43% | -0.17% | 0.43% | -0.43% | 0.65% | 0.43% | |
| GBP | -1.33% | -0.43% | -0.77% | 0.00% | -0.87% | 0.22% | -0.01% | |
| JPY | -0.69% | 0.17% | 0.77% | 0.59% | -0.25% | 0.85% | 0.59% | |
| CAD | -1.30% | -0.43% | -0.01% | -0.59% | -0.87% | 0.26% | 0.00% | |
| AUD | -0.45% | 0.43% | 0.87% | 0.25% | 0.87% | 1.09% | 0.88% | |
| NZD | -1.52% | -0.65% | -0.22% | -0.85% | -0.26% | -1.09% | -0.22% | |
| CHF | -1.29% | -0.43% | 0.01% | -0.59% | -0.01% | -0.88% | 0.22% |
The heat map shows percentage changes of major currencies against each other. The base currency is picked from the left column, while the quote currency is picked from the top row. For example, if you pick the Canadian Dollar from the left column and move along the horizontal line to the US Dollar, the percentage change displayed in the box will represent CAD (base)/USD (quote).

Hơn một triệu người dùng dựa vào FXStreet để có dữ liệu thị trường thời gian thực, công cụ biểu đồ, góc nhìn chuyên gia và tin tức Forex. Lịch kinh tế toàn diện và các hội thảo web giáo dục giúp nhà giao dịch luôn cập nhật và đưa ra quyết định có tính toán. FXStreet có khoảng 60 nhân sự, chia giữa trụ sở Barcelona và nhiều khu vực toàn cầu.
Đọc thêm


