
USD/CHF Price Forecast: Bullish piercing pattern surfaces, sights on 0.79
Bởi Christian Borjon Valencia
Đã cập nhật: 1 Jun 2026


BÀI VIẾT PHỔ BIẾN

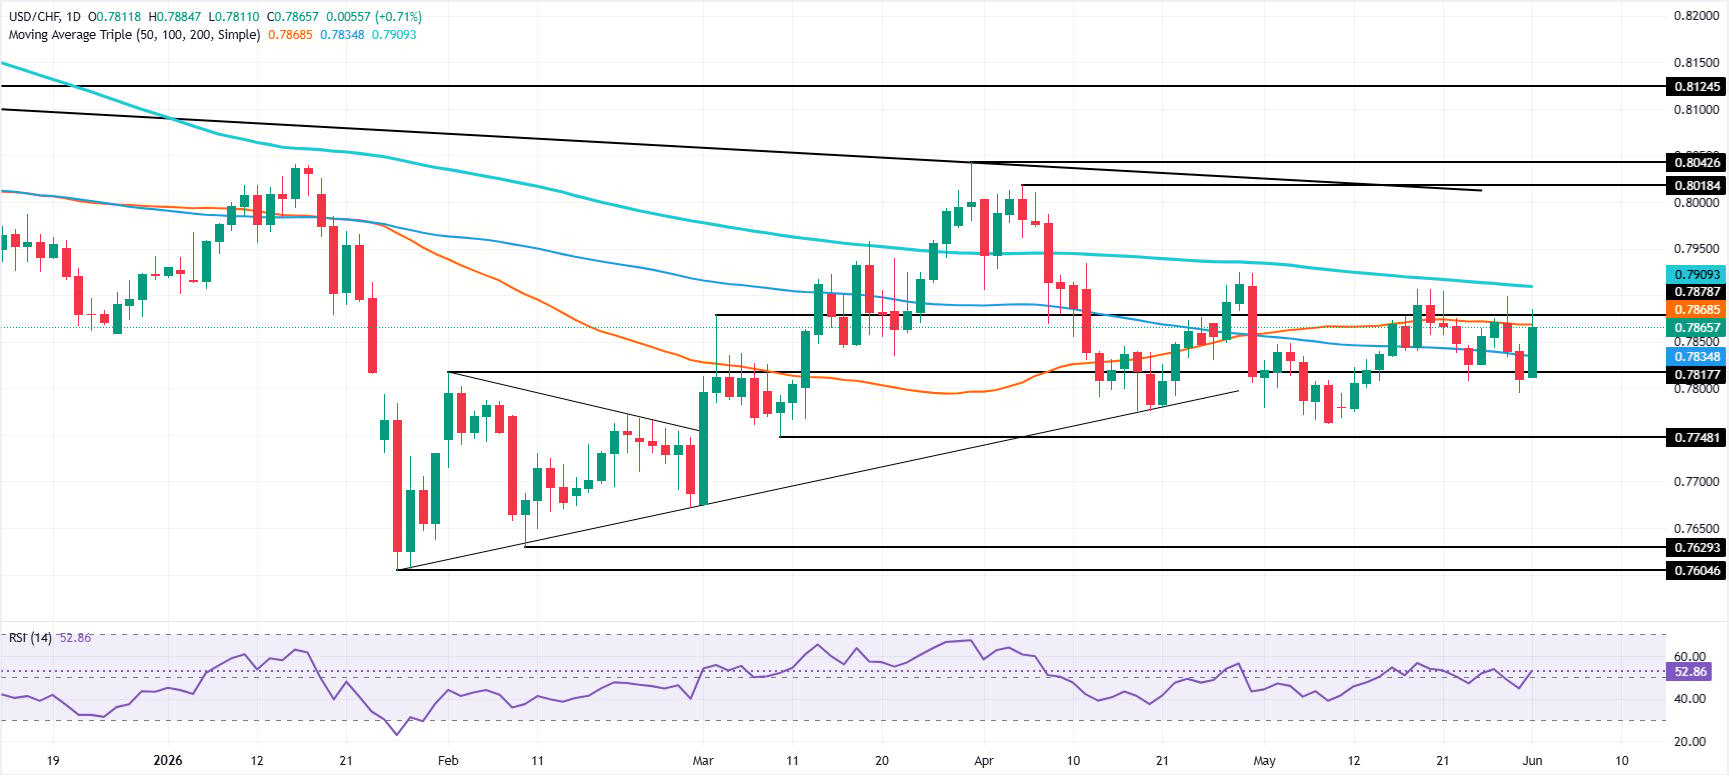
The USD/CHF forms a ‘bullish piercing’ chart pattern, which confirms further upside, but it faces key resistance at the 50-day Simple Moving Average (SMA) at 0.7868. At the time of writing, the pair is trading at 0.70% gains, around 0.7860.
- USD/CHF forms bullish piercing pattern, signaling further upside potential.
- RSI turns bullish as buyers reclaim the 100-day SMA.
- Break above 0.7900 exposes 0.8000 and 0.8042 resistance.
The USD/CHF forms a ‘bullish piercing’ chart pattern, which confirms further upside, but it faces key resistance at the 50-day Simple Moving Average (SMA) at 0.7868. At the time of writing, the pair is trading at 0.70% gains, around 0.7860.
USD/CHF Price Forecast: Technical Outlook
Price action suggests the USD/CHF is consolidating below 0.7900, with buyers gathering momentum, as the pair cleared the 100-day SMA at 0.7834 and the Relative Strength Index (RSI) turned bullish.
On further strength, the USD/CHF can test the 0.7900 mark. Once surpassed, the next stop would be the 0.8000 mark, ahead of the April 6 daily high of 0.8018. A breach of the latter will expose the March 31 swing high at 0.8042, followed by 0.8100.
Downwards, if USD/CHF drops below the 100-day SMA, it would expose the 0.7800 mark. Below this level, the next support would be the May 8 daily low of 0.7761, followed by the March 10 daily low of 0.7748. Underneath the next area of interest would be 0.7700.
USD/CHF Price Chart – Daily
Swiss Franc Price Today
The table below shows the percentage change of Swiss Franc (CHF) against listed major currencies today. Swiss Franc was the strongest against the New Zealand Dollar.
| USD | EUR | GBP | JPY | CAD | AUD | NZD | CHF | |
|---|---|---|---|---|---|---|---|---|
| USD | 0.22% | -0.06% | 0.26% | 0.28% | 0.30% | 0.91% | 0.73% | |
| EUR | -0.22% | -0.26% | 0.00% | 0.06% | 0.14% | 0.70% | 0.49% | |
| GBP | 0.06% | 0.26% | 0.30% | 0.34% | 0.33% | 0.94% | 0.75% | |
| JPY | -0.26% | 0.00% | -0.30% | 0.05% | 0.06% | 0.69% | 0.47% | |
| CAD | -0.28% | -0.06% | -0.34% | -0.05% | 0.01% | 0.62% | 0.43% | |
| AUD | -0.30% | -0.14% | -0.33% | -0.06% | -0.01% | 0.55% | 0.40% | |
| NZD | -0.91% | -0.70% | -0.94% | -0.69% | -0.62% | -0.55% | -0.20% | |
| CHF | -0.73% | -0.49% | -0.75% | -0.47% | -0.43% | -0.40% | 0.20% |
The heat map shows percentage changes of major currencies against each other. The base currency is picked from the left column, while the quote currency is picked from the top row. For example, if you pick the Swiss Franc from the left column and move along the horizontal line to the US Dollar, the percentage change displayed in the box will represent CHF (base)/USD (quote).

Hơn một triệu người dùng dựa vào FXStreet để có dữ liệu thị trường thời gian thực, công cụ biểu đồ, góc nhìn chuyên gia và tin tức Forex. Lịch kinh tế toàn diện và các hội thảo web giáo dục giúp nhà giao dịch luôn cập nhật và đưa ra quyết định có tính toán. FXStreet có khoảng 60 nhân sự, chia giữa trụ sở Barcelona và nhiều khu vực toàn cầu.
Đọc thêm


