
USD/CHF Price Forecast: Hits 11-month high above 0.8100
Bởi Christian Borjon Valencia
Đã cập nhật: 24 Jun 2026


BÀI VIẾT PHỔ BIẾN

The USD/CHF extends its rally for the third straight day this week and refreshes year-to-date (YTD) highs, peaking at 0.8139, which is also an 11-month high. At the time of writing, the pair trades at 0.8124, up 0.34%.
- USD/CHF refreshes YTD highs as rally extends six days.
- RSI enters overbought territory, signaling powerful bullish momentum persists.
- Break above 0.8200 exposes 0.8215 and 0.8300 resistance.
The USD/CHF extends its rally for the third straight day this week and refreshes year-to-date (YTD) highs, peaking at 0.8139, which is also an 11-month high. At the time of writing, the pair trades at 0.8124, up 0.34%.
USD/CHF Price Forecast: Technical outlook
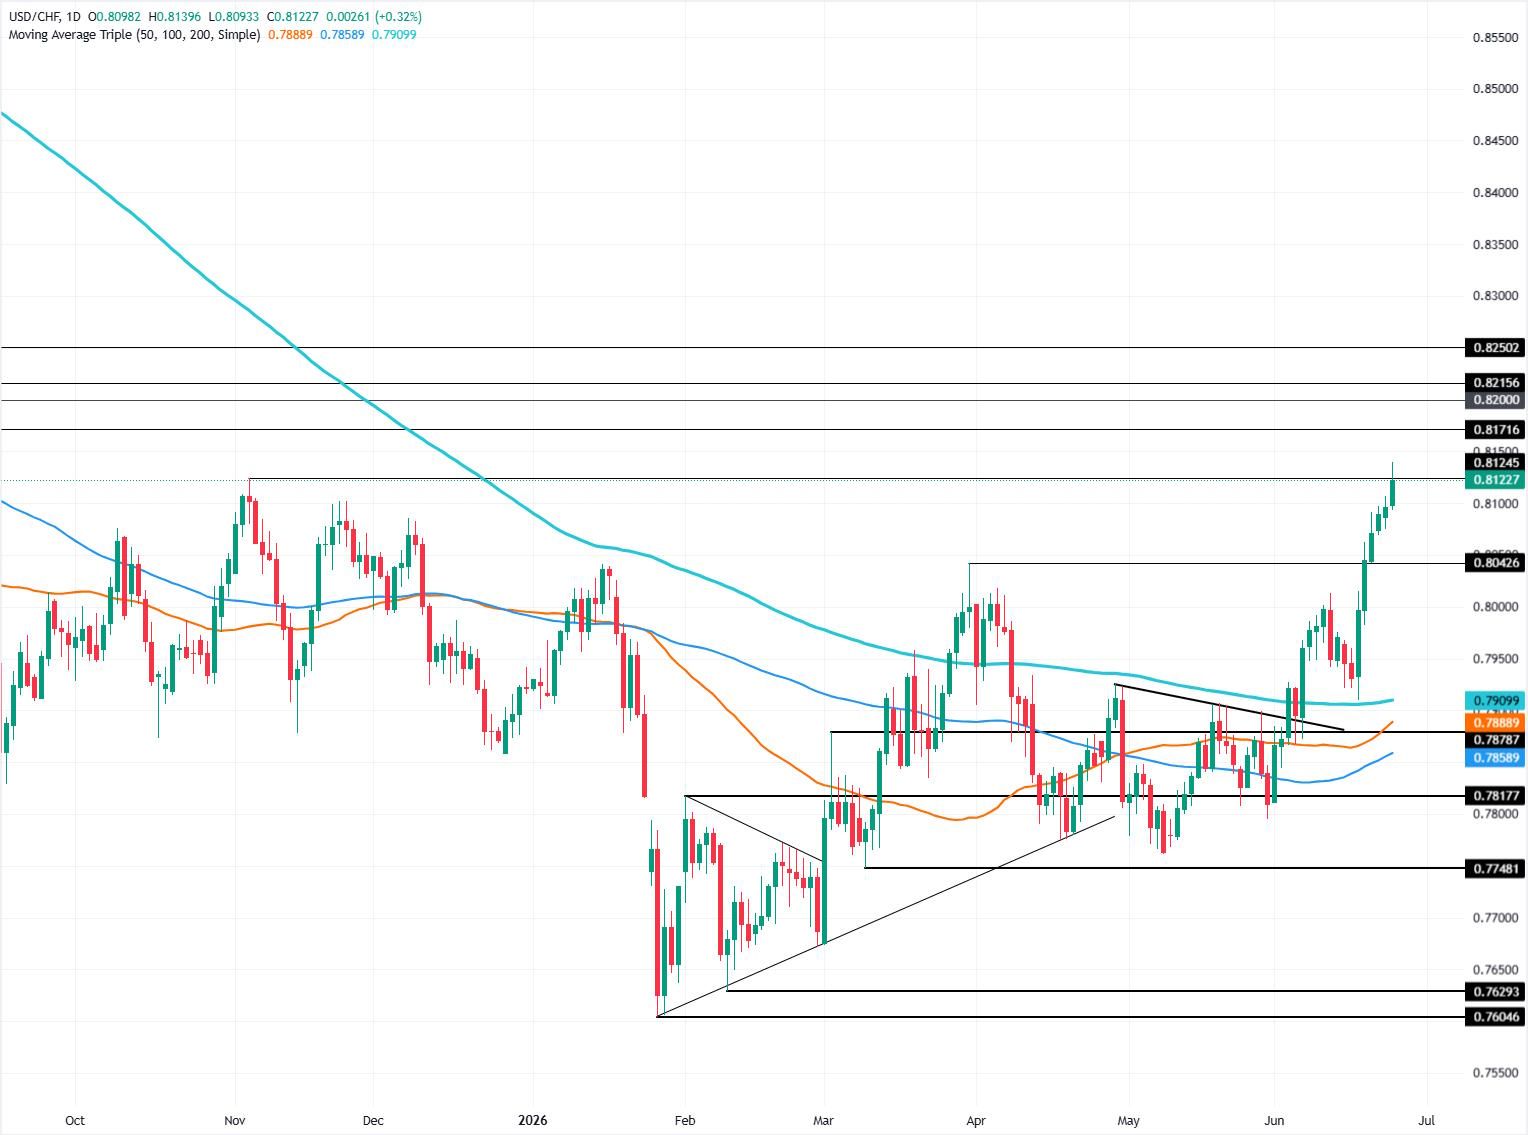
The USD/CHF has been rallying for six days, and if it closes Wednesday’s session above 0.8100, bulls could reach the 0.8200 level rather sooner than later.
The Relative Strength Index (RSI) shows the pair is overbought, but it is short of the 80 level, considered the most extreme. When RSI is between 70 and 80, the uptrend is at its strongest; hence, readings above 80 are most precise for indicating market tops.
If USD/CHF clears 0.8200, the next resistance would be the June 19, 2025, daily high at 0.8215, ahead of 0.8250. A breach of the latter will expose 0.8300. On the other hand, if bears drive the pair below 0.8100, the next support would be the March 31 swing high of 0.8042. Below this level is 0.8000.
USD/CHF Price Chart – Daily
Swiss Franc Price This week
The table below shows the percentage change of Swiss Franc (CHF) against listed major currencies this week. Swiss Franc was the strongest against the New Zealand Dollar.
| USD | EUR | GBP | JPY | CAD | AUD | NZD | CHF | |
|---|---|---|---|---|---|---|---|---|
| USD | 0.93% | 0.21% | 0.26% | 0.47% | 1.58% | 1.69% | 0.60% | |
| EUR | -0.93% | -0.73% | -0.61% | -0.41% | 0.69% | 0.77% | -0.32% | |
| GBP | -0.21% | 0.73% | -0.13% | 0.26% | 1.38% | 1.36% | 0.38% | |
| JPY | -0.26% | 0.61% | 0.13% | 0.13% | 1.29% | 1.27% | 0.28% | |
| CAD | -0.47% | 0.41% | -0.26% | -0.13% | 1.16% | 1.20% | 0.11% | |
| AUD | -1.58% | -0.69% | -1.38% | -1.29% | -1.16% | -0.03% | -0.94% | |
| NZD | -1.69% | -0.77% | -1.36% | -1.27% | -1.20% | 0.03% | -0.94% | |
| CHF | -0.60% | 0.32% | -0.38% | -0.28% | -0.11% | 0.94% | 0.94% |
The heat map shows percentage changes of major currencies against each other. The base currency is picked from the left column, while the quote currency is picked from the top row. For example, if you pick the Swiss Franc from the left column and move along the horizontal line to the US Dollar, the percentage change displayed in the box will represent CHF (base)/USD (quote).

Hơn một triệu người dùng dựa vào FXStreet để có dữ liệu thị trường thời gian thực, công cụ biểu đồ, góc nhìn chuyên gia và tin tức Forex. Lịch kinh tế toàn diện và các hội thảo web giáo dục giúp nhà giao dịch luôn cập nhật và đưa ra quyết định có tính toán. FXStreet có khoảng 60 nhân sự, chia giữa trụ sở Barcelona và nhiều khu vực toàn cầu.
Đọc thêm


