
USD/CHF Price Forecast: RSI nears overbought territory as the pair climbs to near seven-month highs
Bởi Vishal Chaturvedi
Đã cập nhật: 19 Jun 2026


BÀI VIẾT PHỔ BIẾN

USD/CHF extends gains on Friday even as the US Dollar (USD) eases slightly after rising to more than one-year highs. Diverging monetary policy expectations between the Federal Reserve (Fed) and the Swiss National Bank (SNB) keep demand tilted toward the US Dollar over the Swiss Franc (CHF).
- USD/CHF climbs to its highest level since November 2025 as Fed-SNB policy divergence favors the Greenback.
- Fed officials keep the door open to rate hikes, while subdued Swiss inflation allows the SNB to stay on hold.
- Technically, USD/CHF retains a bullish bias with the RSI nearing overbought territory.
USD/CHF extends gains on Friday even as the US Dollar (USD) eases slightly after rising to more than one-year highs. Diverging monetary policy expectations between the Federal Reserve (Fed) and the Swiss National Bank (SNB) keep demand tilted toward the US Dollar over the Swiss Franc (CHF).
At the time of writing, USD/CHF trades around 0.8080, its highest level since November 2025. Meanwhile, the US Dollar Index (DXY), which tracks the Greenback's value against a basket of six major currencies, trades around 100.80 after touching 101.13 earlier in the day, its highest level since May 2025.
Earlier this week, both the Fed and SNB left interest rates unchanged. However, the Fed struck a hawkish tone as policymakers reiterated their commitment to bringing inflation back to the 2% target, while the updated dot plot showed that nearly half of FOMC members expect at least one rate hike this year.
Meanwhile, low inflation in Switzerland has allowed policymakers to maintain their current policy stance. SNB Chairman Martin Schlegel said on Thursday that "at the moment it is not necessary to act on interest rates" and added that "everything between 0% and 2% is fine on inflation."
Against this backdrop, the near-term technical outlook for USD/CHF remains bullish, with the Relative Strength Index (RSI) approaching overbought territory and the pair trading comfortably above its key long-term moving averages.
Technical analysis:
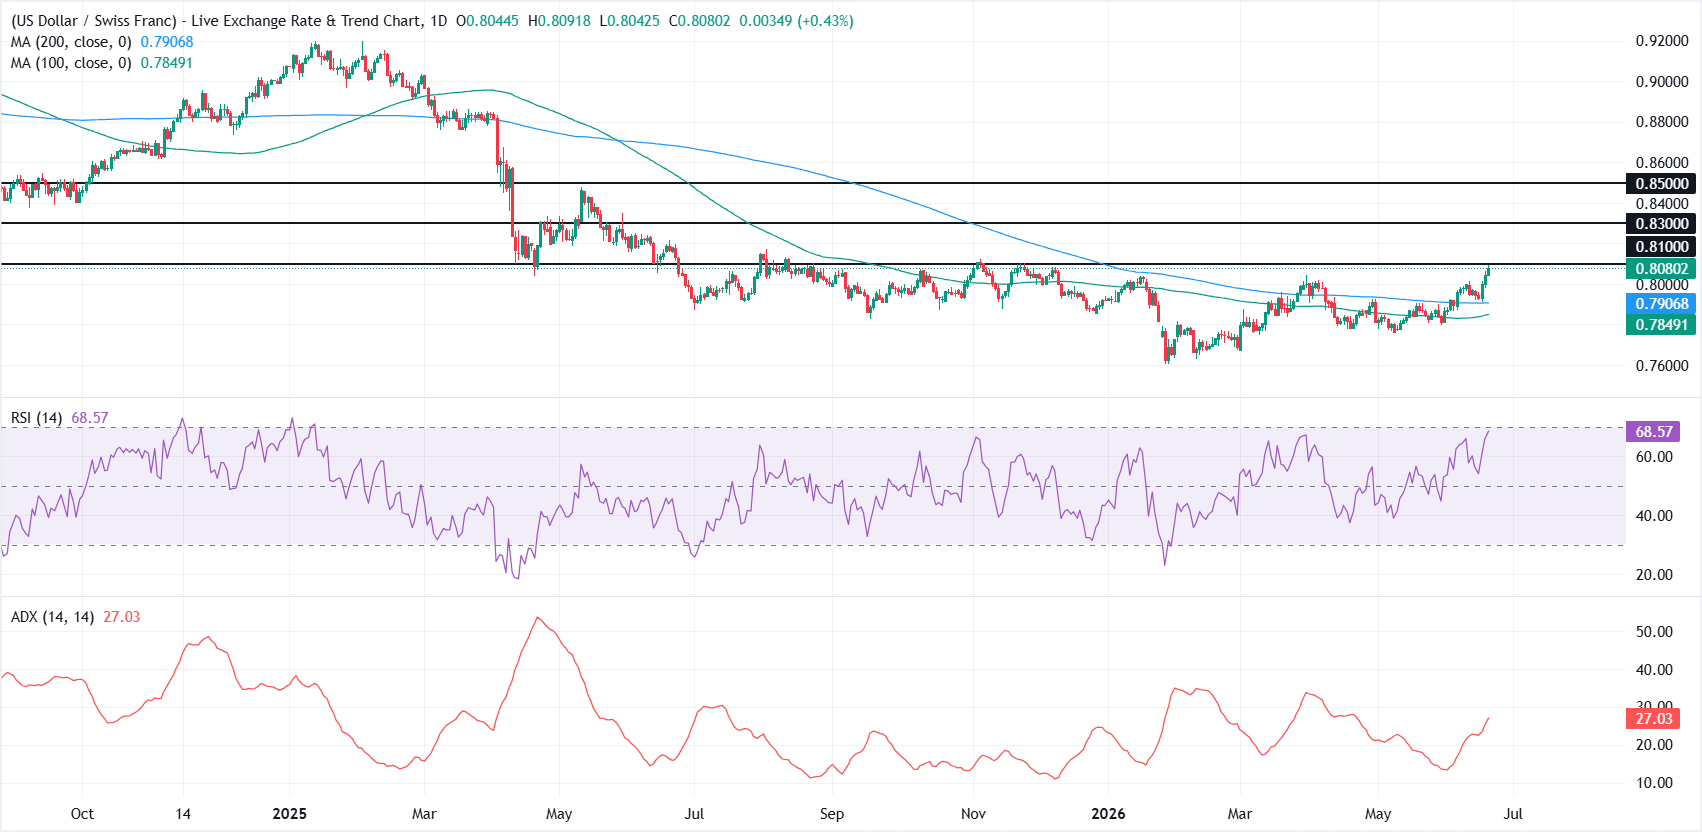
On the daily chart, USD/CHF trades at 0.8080 with a constructive bullish bias, holding above both the 100-day and 200-day Simple Moving Averages (SMAs) at 0.7849 and 0.7907, respectively.
The location of price over these medium- and long-term SMAs suggests the recent advance remains supported, while the Relative Strength Index (RSI) at 68.6 flirts with overbought territory and the Average Directional Index (ADX) near 27 hints that the developing uptrend is gaining strength rather than merely consolidating.
On the topside, immediate resistance is aligned with the nearby horizontal barrier at 0.8100; a daily close above this level would open the door toward the next resistance at 0.8300, ahead of 0.8500. On the downside, initial support is seen at the 200-day SMA around 0.7907, with the 100-day SMA at 0.7849 reinforcing a deeper demand zone should a corrective pullback unfold.
(The technical analysis of this story was written with the help of an AI tool.)
US Dollar Price Today
The table below shows the percentage change of US Dollar (USD) against listed major currencies today. US Dollar was the strongest against the Swiss Franc.
| USD | EUR | GBP | JPY | CAD | AUD | NZD | CHF | |
|---|---|---|---|---|---|---|---|---|
| USD | -0.07% | -0.11% | -0.05% | 0.28% | 0.04% | 0.30% | 0.37% | |
| EUR | 0.07% | -0.06% | 0.04% | 0.35% | 0.13% | 0.35% | 0.45% | |
| GBP | 0.11% | 0.06% | 0.09% | 0.41% | 0.18% | 0.43% | 0.51% | |
| JPY | 0.05% | -0.04% | -0.09% | 0.32% | 0.11% | 0.34% | 0.42% | |
| CAD | -0.28% | -0.35% | -0.41% | -0.32% | -0.19% | 0.01% | 0.10% | |
| AUD | -0.04% | -0.13% | -0.18% | -0.11% | 0.19% | 0.23% | 0.34% | |
| NZD | -0.30% | -0.35% | -0.43% | -0.34% | -0.01% | -0.23% | 0.07% | |
| CHF | -0.37% | -0.45% | -0.51% | -0.42% | -0.10% | -0.34% | -0.07% |
The heat map shows percentage changes of major currencies against each other. The base currency is picked from the left column, while the quote currency is picked from the top row. For example, if you pick the US Dollar from the left column and move along the horizontal line to the Japanese Yen, the percentage change displayed in the box will represent USD (base)/JPY (quote).

Hơn một triệu người dùng dựa vào FXStreet để có dữ liệu thị trường thời gian thực, công cụ biểu đồ, góc nhìn chuyên gia và tin tức Forex. Lịch kinh tế toàn diện và các hội thảo web giáo dục giúp nhà giao dịch luôn cập nhật và đưa ra quyết định có tính toán. FXStreet có khoảng 60 nhân sự, chia giữa trụ sở Barcelona và nhiều khu vực toàn cầu.
Đọc thêm


