
USD/CHF Price Forecast: Sideways trading below 0.7900, awaiting news from Iran
Bởi Guillermo Alcala
Đã cập nhật: 22 May 2026


BÀI VIẾT PHỔ BIẾN

The Swiss Franc (CHF) consolidates right below 0.7870 against the US Dollar (USD) on Friday. The pair retreated from the 0.7900 area over the previous two days, but remains steady within the weekly range, with investors wary of taking risks, amid confusing messages from the Middle East.
- USD/CHF steadies near 0.7870 after pulling back from the 0.7900 area.
- Market volatility remains subdued on Friday, with markets awaiting developments from the US-Iran conflict.
- The pair has lost momentum after failing to extend gains beyond 0.7900.
The Swiss Franc (CHF) consolidates right below 0.7870 against the US Dollar (USD) on Friday. The pair retreated from the 0.7900 area over the previous two days, but remains steady within the weekly range, with investors wary of taking risks, amid confusing messages from the Middle East.
The Iran-US peace deal seems stalled, amid divergences in the nuclear issue and control of the Strait of Hormuz. Markets, however, cling to hopes of a negotiated end of the conflict, as Iranian authorities revise the latest peace proposal submitted by the US. On Thursday, the US Secretary of State Marco Rubio affirmed that there are “good signs” in the peace process, which contributed to support a moderate optimism.
Technical Analysis: Bullish momentum is starting to fade
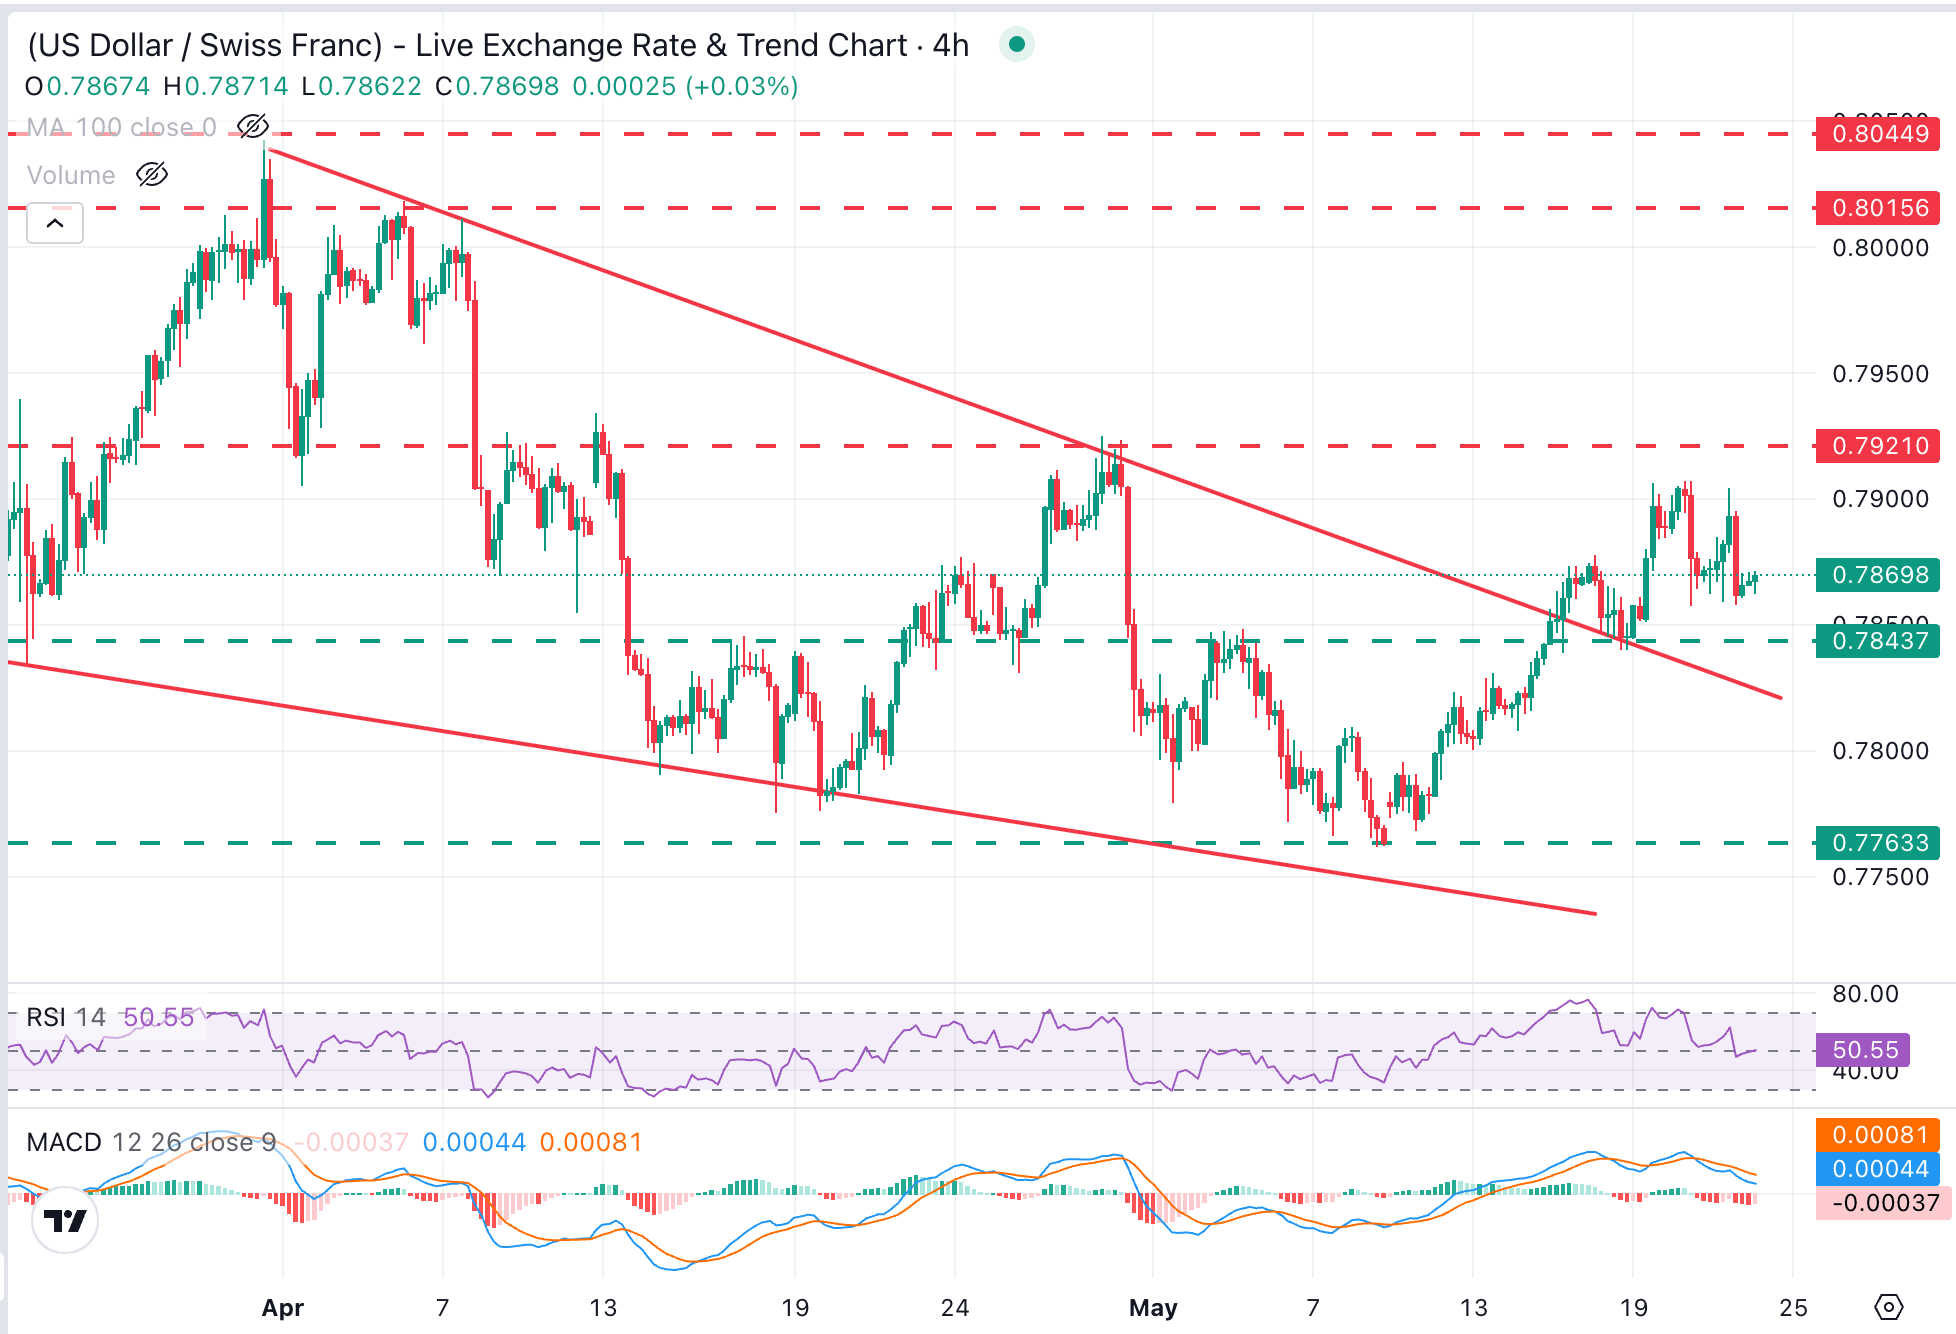
USD/CHF trades at 0.7869, holding a capped tone after failing to find acceptance above 0.7900 earlier this week. The Relative Strength Index (RSI) around 50 signals flat momentum, while the Moving Average Convergence Divergence (MACD) remains slightly negative, which together hint that bulls have lost steam.
On the topside, the resistance area between 0.7920 and 0.7930 (April 8, 13, and 29 highs) should give way in order to clear the path towards the 0.8000 psychological level and the early April highs, around 0.8015.
A confirmation below May 18 lows at 0.7840, and the broken trendline, which is now lying in the area of 0.7825, on the contrary, is likely to give fresh hopes for bears, to retest May's bottom, at the 0.7765 area
(The technical analysis of this story was written with the help of an AI tool.)
US Dollar Price Today
The table below shows the percentage change of US Dollar (USD) against listed major currencies today. US Dollar was the strongest against the Australian Dollar.
| USD | EUR | GBP | JPY | CAD | AUD | NZD | CHF | |
|---|---|---|---|---|---|---|---|---|
| USD | 0.14% | 0.12% | 0.10% | 0.13% | 0.31% | 0.25% | 0.13% | |
| EUR | -0.14% | -0.01% | -0.04% | -0.01% | 0.18% | 0.12% | -0.02% | |
| GBP | -0.12% | 0.01% | -0.02% | 0.01% | 0.18% | 0.14% | -0.01% | |
| JPY | -0.10% | 0.04% | 0.02% | 0.05% | 0.21% | 0.15% | 0.00% | |
| CAD | -0.13% | 0.01% | -0.01% | -0.05% | 0.16% | 0.11% | -0.03% | |
| AUD | -0.31% | -0.18% | -0.18% | -0.21% | -0.16% | -0.05% | -0.22% | |
| NZD | -0.25% | -0.12% | -0.14% | -0.15% | -0.11% | 0.05% | -0.15% | |
| CHF | -0.13% | 0.02% | 0.01% | -0.01% | 0.03% | 0.22% | 0.15% |
The heat map shows percentage changes of major currencies against each other. The base currency is picked from the left column, while the quote currency is picked from the top row. For example, if you pick the US Dollar from the left column and move along the horizontal line to the Japanese Yen, the percentage change displayed in the box will represent USD (base)/JPY (quote).

Hơn một triệu người dùng dựa vào FXStreet để có dữ liệu thị trường thời gian thực, công cụ biểu đồ, góc nhìn chuyên gia và tin tức Forex. Lịch kinh tế toàn diện và các hội thảo web giáo dục giúp nhà giao dịch luôn cập nhật và đưa ra quyết định có tính toán. FXStreet có khoảng 60 nhân sự, chia giữa trụ sở Barcelona và nhiều khu vực toàn cầu.
Đọc thêm


