
要点速览
金油比 显示 1 盎司黄金可以购买多少桶原油。
2026 年,该比率从 78 大幅跌破至 43,随后在 52附近企稳,显示黄金与原油之间发生了重大重新定价。
从历史上看,该比率通常会在 10 至 30 桶附近企稳,因此较高的读数可能意味着市场处于异常状态。
该比率有助于进行历史比较和把握市场背景,但 并不是一个独立的交易指标。
什么是金油比
金油比 是一个简单的数学比率,用于比较 1 盎司黄金 与 1 桶原油的价格。它显示 1 盎司黄金的价值可以购买多少桶原油。
该比率通常用于研究 金价 与 油价之间的历史关系。它帮助交易者和分析师判断,相对于黄金而言,原油看起来是相对昂贵还是便宜。
2026 年金油比’的当前状态
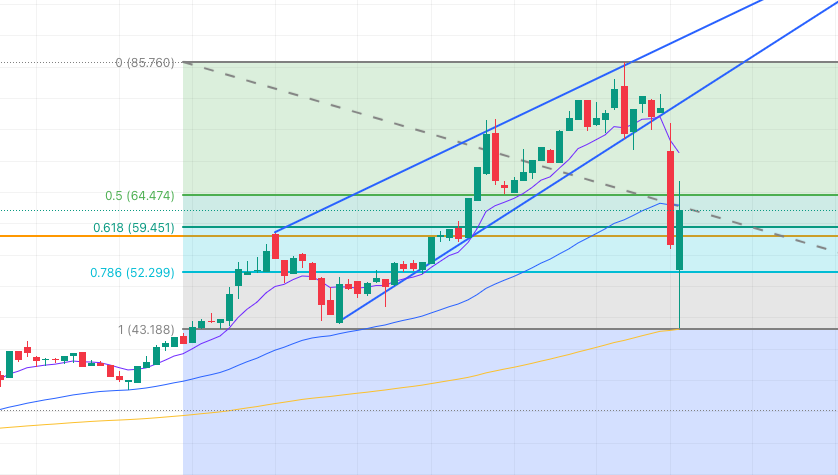
2026 年, 金油比 周线图大幅下行。在跌破约 78 桶 的三角形’支撑线后,比率继续快速下探,短暂触及 43 桶,随后在几天内于 52 桶 附近企稳。
这是一次大幅压缩走势。它表明,由于伊朗战争,油价在非常短的时间内迅速飙升。
历史平均水平
从历史上看,该比率通常会稳定在 1 盎司黄金兑换 10 至 30 桶原油附近。这个长期区间很重要,因为它为判断当前读数是偏离过大还是更接近历史常态提供了背景。
明显高于该历史区间的读数通常反映出异常的市场状况(例如当前的伊朗与美国战争)。这可能包括油价暴跌、金价飙升,或两类资产之间暂时失衡。
重要提示: 比率偏高或偏低本身并不是交易信号。它只是一个相对价值参考。
金油比的解读与意义
金油比 的主要价值在于解读,而非预测。它显示原油相对于黄金在一段时间内的表现,以及这种关系是否出现了异常拉伸。
异常偏高的比率通常会引发 均值回归的可能性。从实际角度看,这可能意味着油价无法长期维持在异常扭曲的水平,最终可能回归到相对于黄金更正常的定价关系。
交易者如何使用金油比
交易者主要将 金油比 作为宏观背景工具,帮助他们判断是否应投资黄金;有时,它也有助于判断是否应投资原油。它有助于界定当前 黄金 与 原油 之间的关系在历史上看是正常、压缩还是拉伸。
它还可以支持更广泛的市场解读。例如,比率下降通常意味着原油走强速度快于黄金,而比率上升通常意味着黄金跑赢原油,或原油走弱速度更快。
专业提示: 应结合价格结构、宏观背景和供给状况使用该比率,而不是孤立看待。
金油比的局限性
金油比 仅仅是一种数学关系。它无法解释驱动金价或油价的所有因素,也不应被视为独立的预测模型。
黄金和原油受不同因素影响。黄金对实际收益率、央行需求和避险情绪反应强烈,而原油则对供应中断、产量政策和全球需求状况更为敏感。
这就是为什么该比率可作为额外的洞察层面加以参考,但不能作为未来价格走势的直接预测工具。
常见问题
较高的金油比意味着什么?
较高的 金油比 意味着 1 盎司黄金可以购买比平时更多的原油。这通常表明原油相对疲弱、黄金相对强势,或两者兼而有之。
金油比是交易指标吗?
不是。 金油比 并不是一个独立的交易指标。它是一种相对价值衡量工具,有助于提供市场背景。
金油比的历史平均水平是多少?
从历史上看,该比率通常会稳定在 1 盎司黄金兑换 10 至 30 桶原油附近。在评估当前比率是否显得过度拉伸时,这一区间通常被用作长期参考点。


