

Bitcoin vs Gold Outlook: Sell-off fears intensify as Middle East tensions escalate
- Bitcoin slides below $63,000 amid persistent risk-averse sentiment attributed to renewed tensions in the Middle East.
- Gold approaches $4,000 as its technical outlook deteriorates further, reflected by downtrending moving averages.
- Increasing futures Open Interest fails to lift BTC and XAU’s outlook.
Bitcoin (BTC) and Gold (XAU) remain under pressure at the time of writing on Monday. The Crypto King has slipped below $63,000, while XAU approaches the psychologically important $4,000 support level.
The drawdowns indicate that risk-averse sentiment is dominant as investors continue to assess the impact of renewed geopolitical tensions in the Middle East.
US-Iran ceasefire disintegrates amid renewed tensions

United States (US) President Donald Trump has said he would reinstate a blockade of Iranian ports in the Strait of Hormuz. A CNN report highlighted that this development could see the US act as the strait’s “guardian” and charge any other ships for passage.
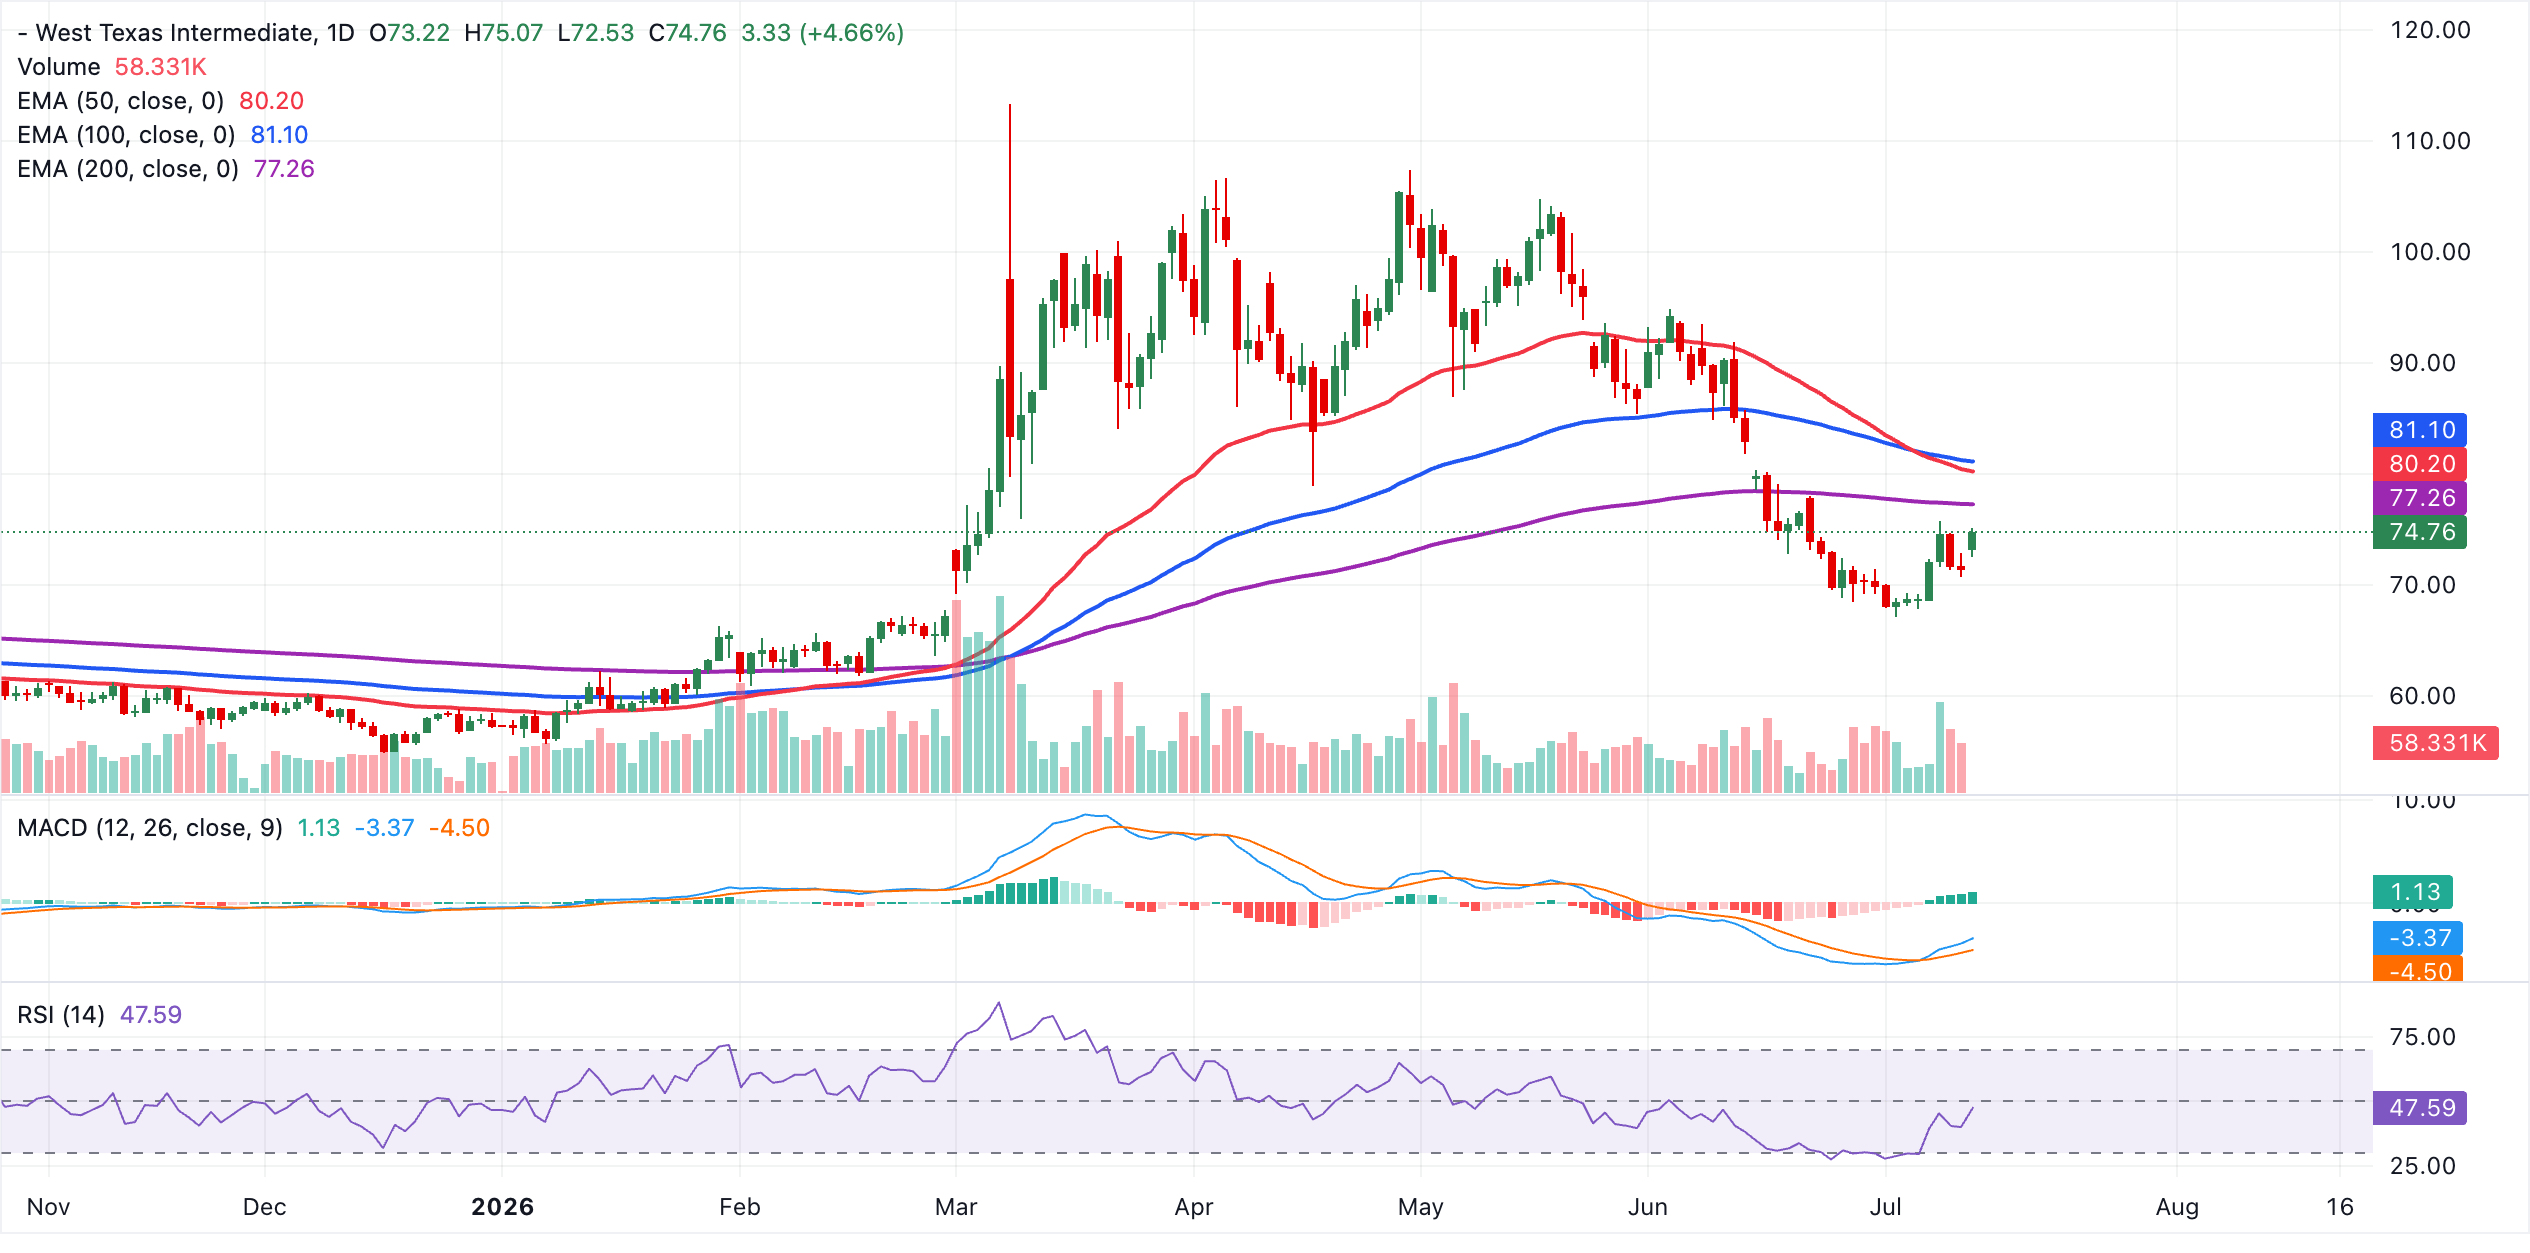
US attacks on Iran have intensified and expanded beyond the coastal areas bordering the Strait of Hormuz, according to Iranian media reports. On the other hand, the Iranian military announced it has struck US allies in the region, including Kuwait and Bahrain, further deteriorating the ceasefire agreement. Oil prices continue to tick up, with the West Texas Intermediate (WTI) trading near $75 at the time of writing.
Bitcoin pressured despite modest increase in futures activity
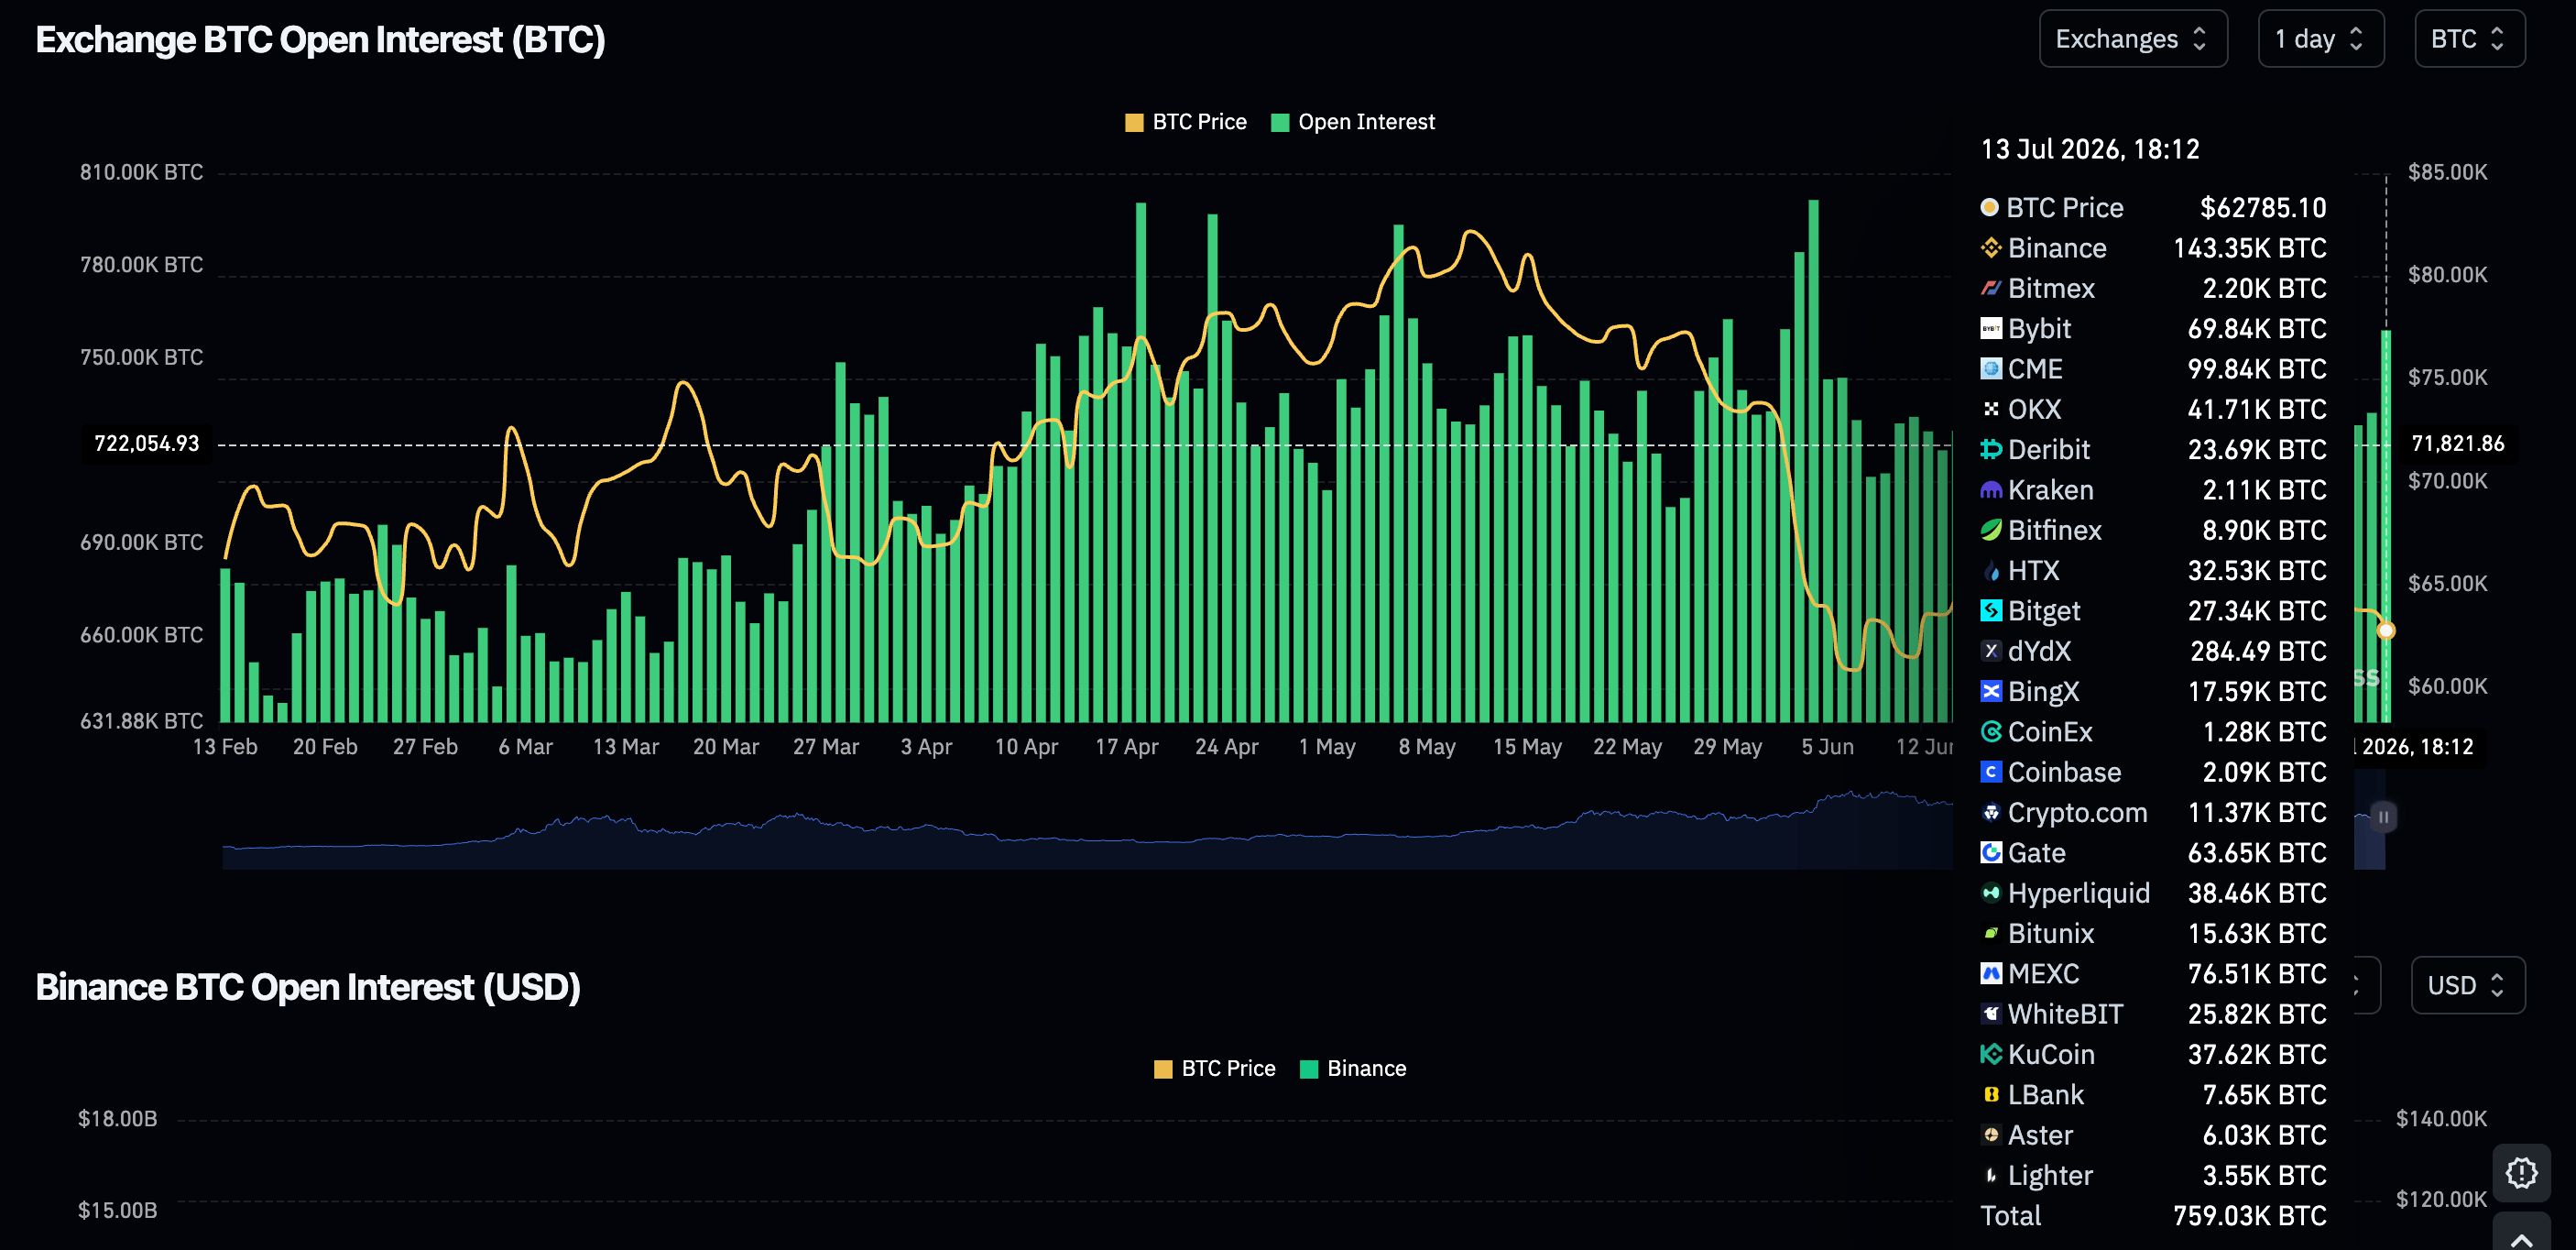
Bitcoin derivatives have defied the odds to attract a notable increase in investor interest, as reflected in perpetual futures Open Interest (OI), which reached roughly 760,000 BTC on Monday, up from 732,000 the day before. While the recent rise in open interest (OI) has yet to translate into a direct price movement, a continued uptick could provide additional market momentum, potentially supporting a sustained Bitcoin rebound.
Bitcoin maintains a bearish near-term tone as it holds well below the 50-day, 100-day and 200-day Exponential Moving Averages (EMAs) clustered around $65,193, $68,675 and $74,713 respectively. The the Relative Strength Index (RSI) at about 48 on the daily chart leans slightly to the downside while the positive yet easing Moving Average Convergence Divergence (MACD) suggests fading bullish momentum within an overall capped environment.
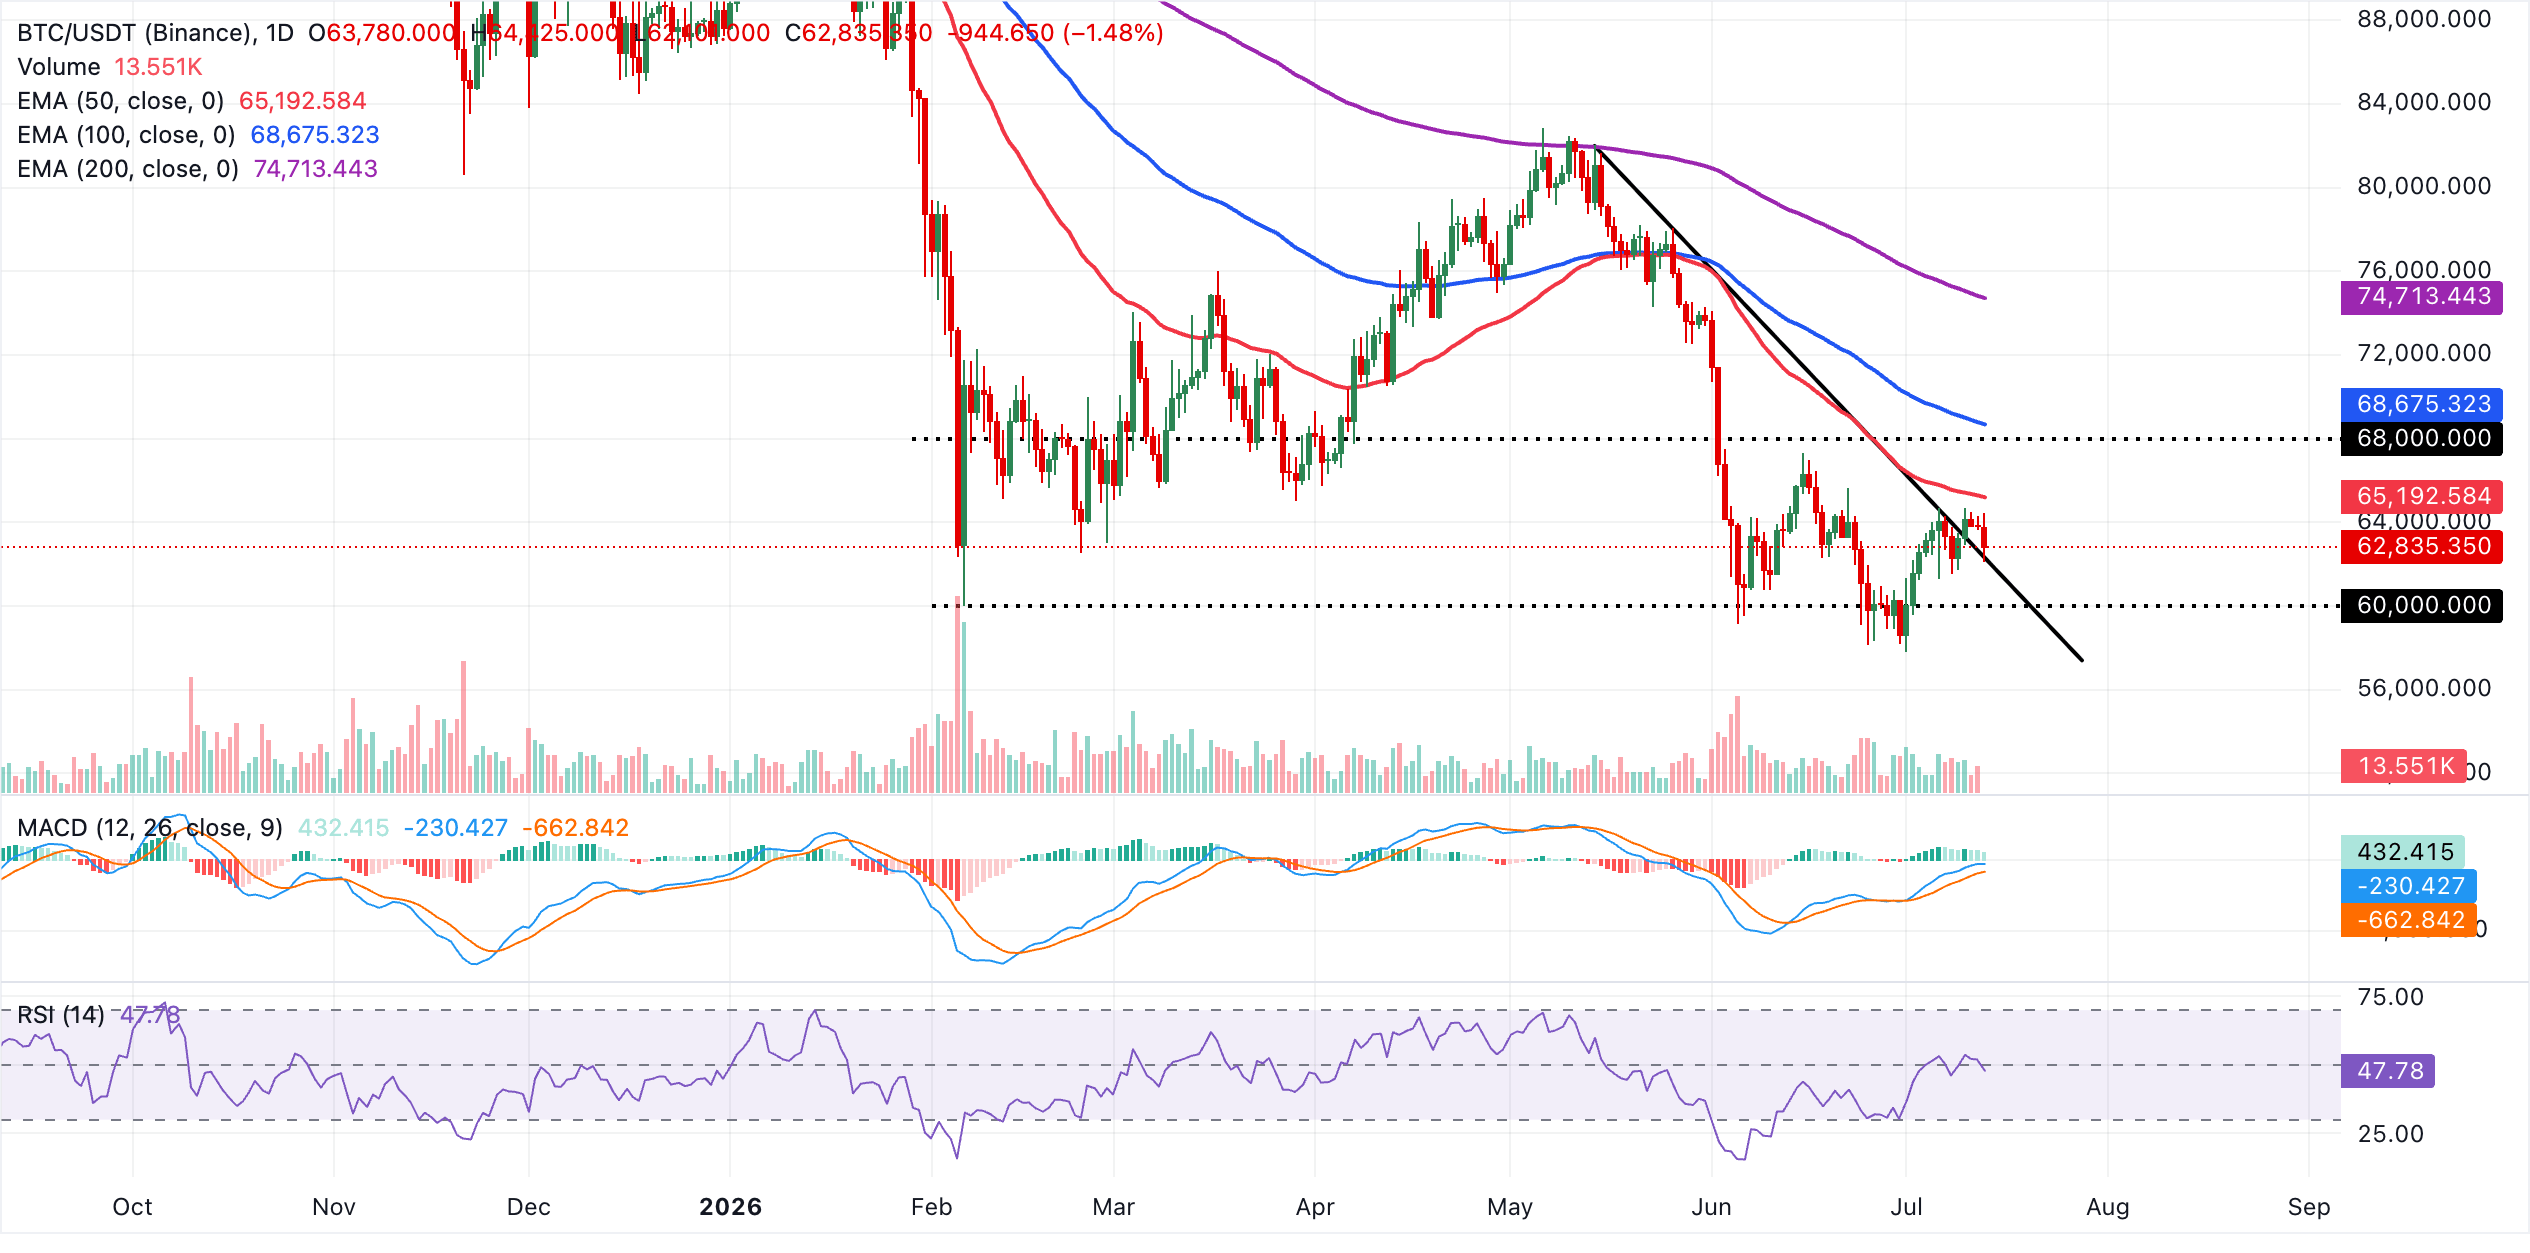
Immediate resistance lies at the 50-day EMA around $65,193, followed by the 100-day EMA near $68,675 and then the 200-day EMA close to $74,713, levels that collectively define a broad supply zone limiting recovery attempts. Looking down, initial support is provided by the reclaimed downward trendline break level around $62,106. A break beneath this area would expose lower levels, reinforcing the prevailing bearish bias while the pair remains trapped under the major EMAs.
Tokenized Gold derivatives jump as price slides
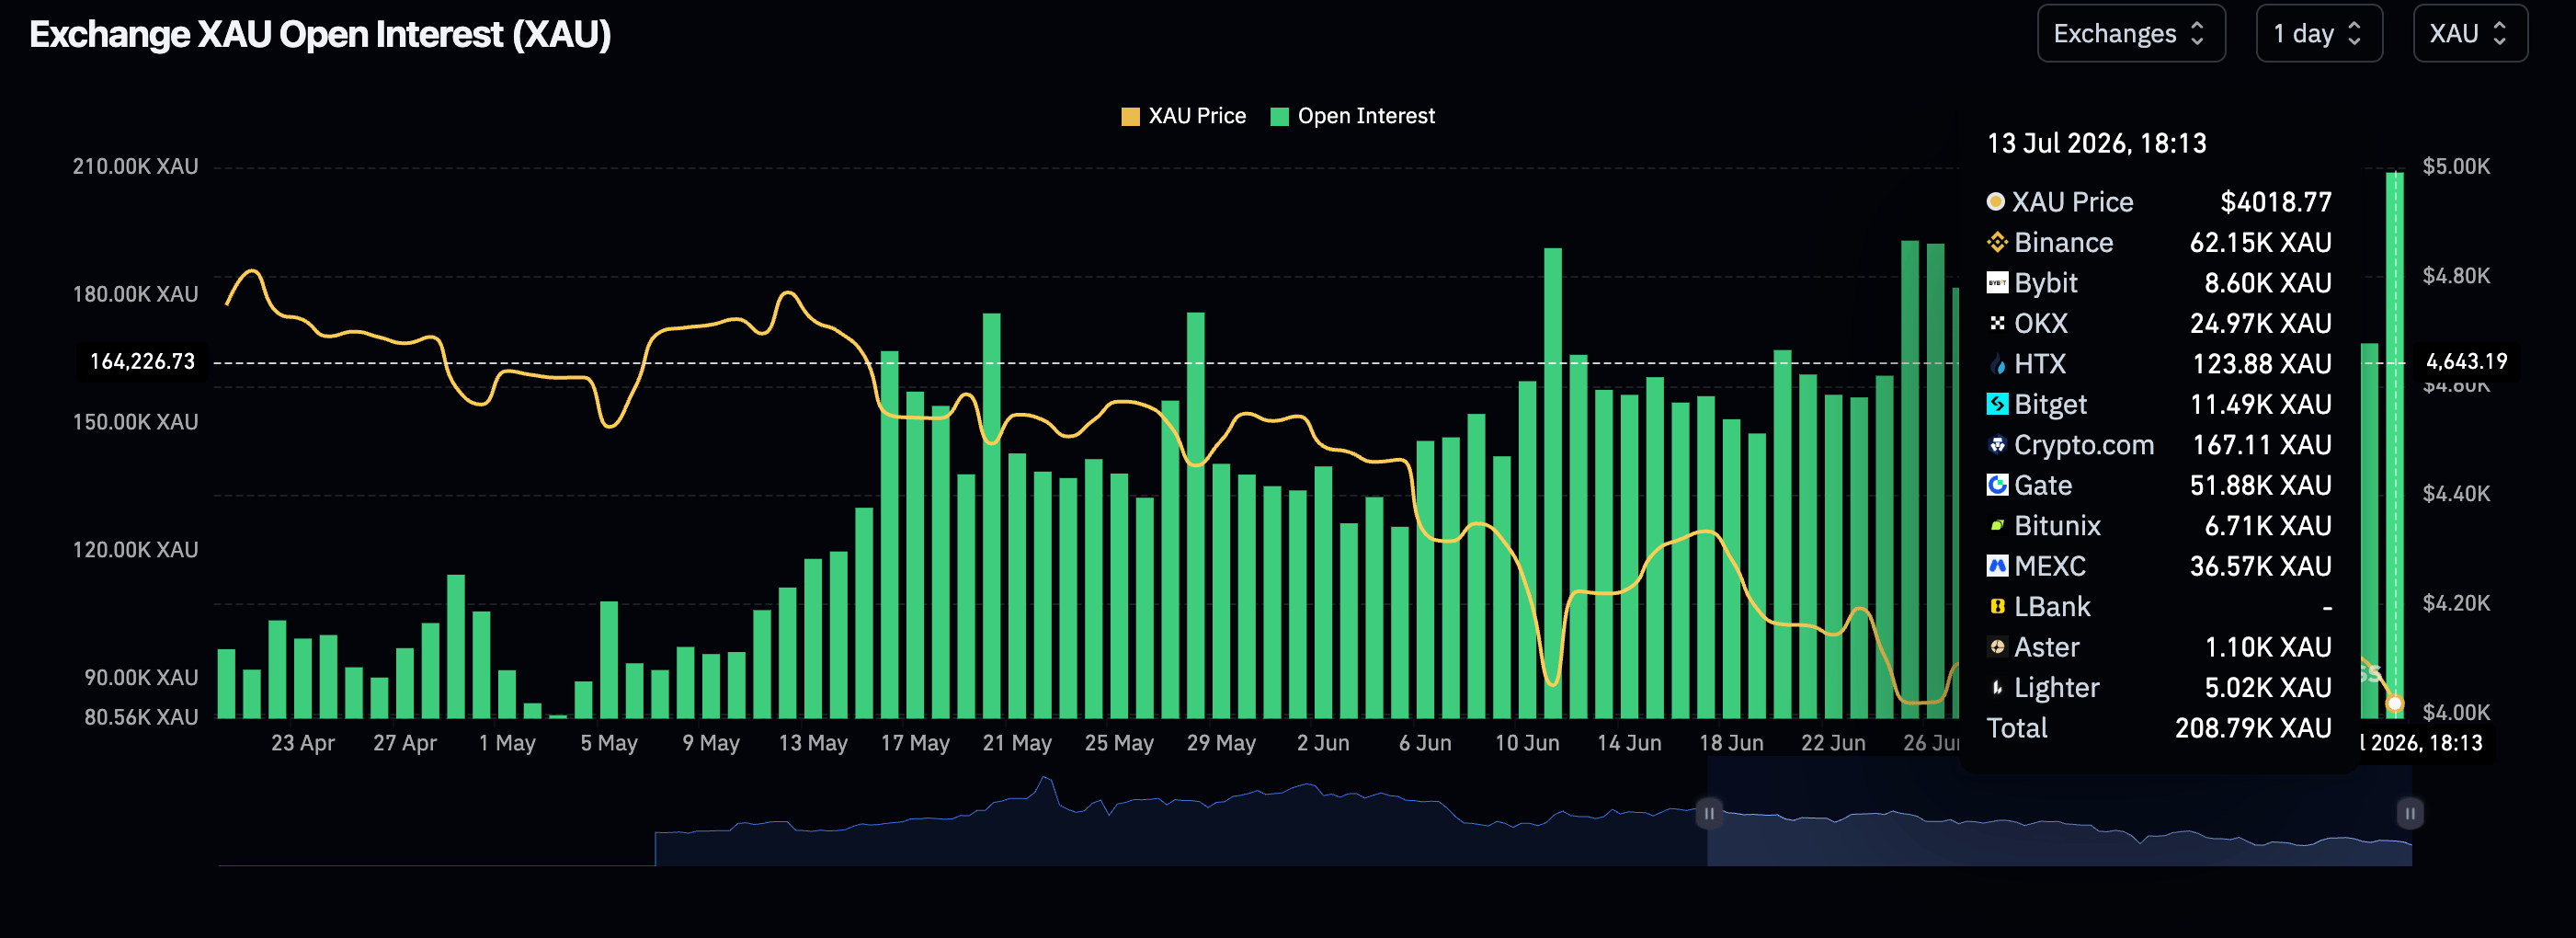
The XAU tokenized derivatives market across crypto exchange platforms has climbed to 208,000 XAU on Monday, from 169,000 XAU the previous day. While the surge has yet to meaningfully impact gold prices, it underscores a broader rotation of crypto investor capital toward real-world assets (RWAs).
XAU/USD remains under a bearish near-term bias as it holds below the 50-day, the 200-day, and the 100-day EMAs clustered between roughly $4,300 and $4,420, suggesting that recent gains are still unfolding within a broader capped structure. While the MACD histogram is positive and above zero, hinting at an ongoing corrective rebound, the RSI around 38 keeps directional pressure tilted to the downside, indicating that recovery attempts could struggle against the prevailing downtrend.
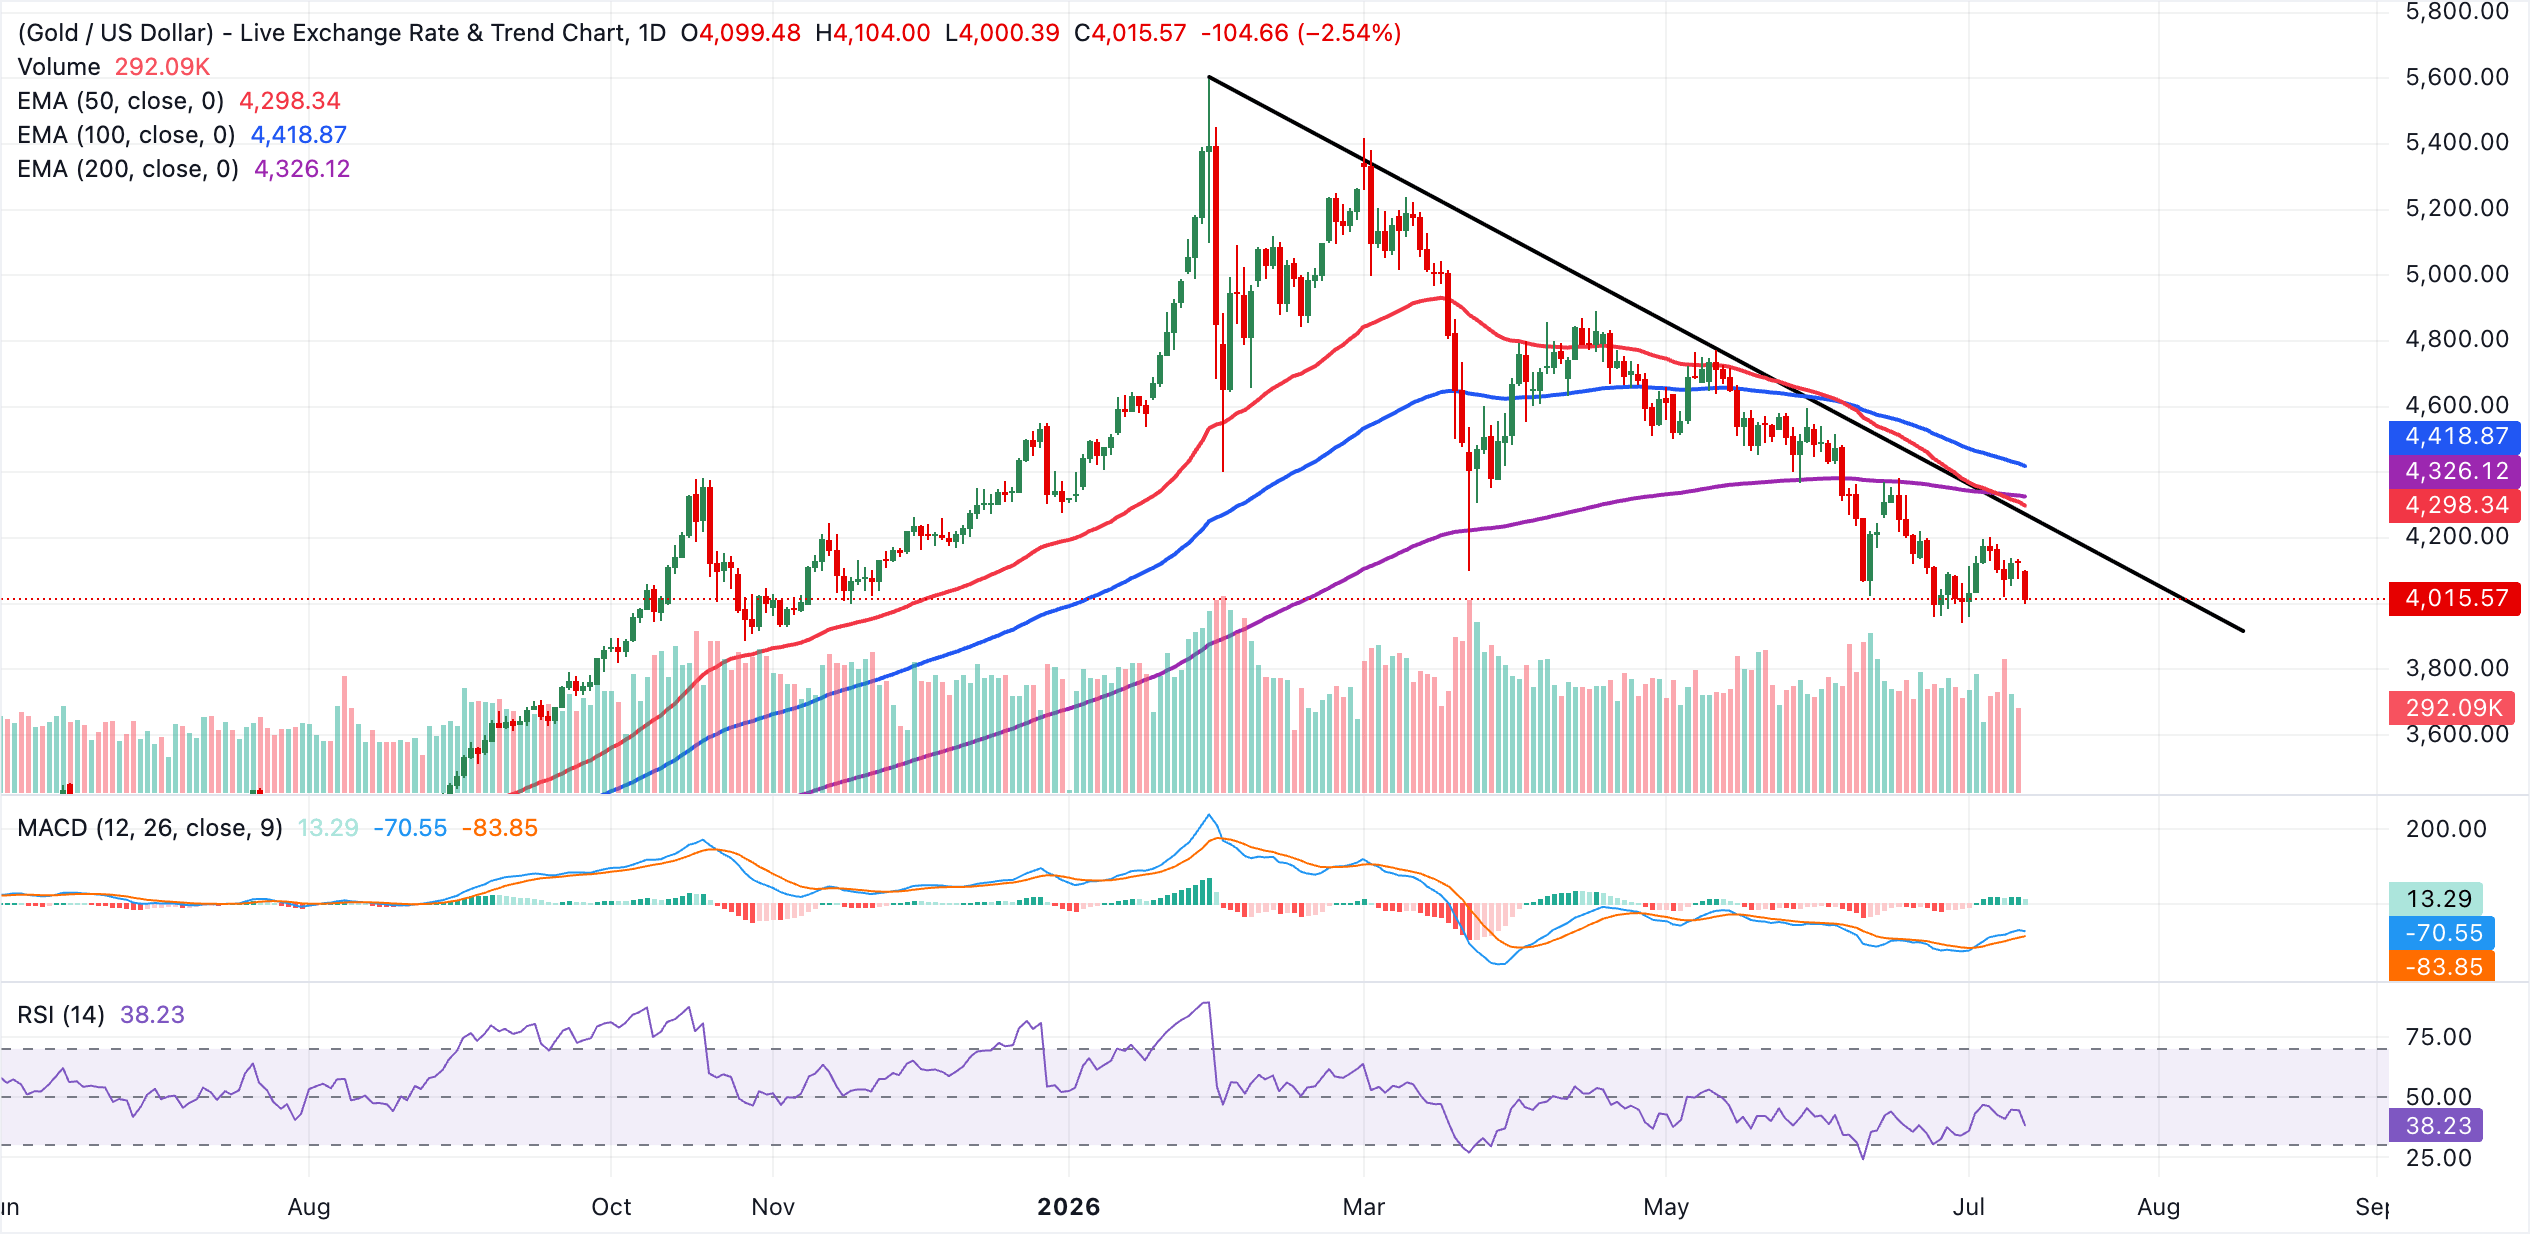
Initial resistance appears at the downward resistance trendline break area near $4,178, where sellers may re-emerge to defend the broader bearish structure. Above this region, the 50-day EMA at $4,298 lines up as a subsequent barrier, followed by the 200-day EMA at $4,326 and the 100-day EMA at $4,419, which together form a dense supply zone that would need to be decisively reclaimed to ease the current downside bias. Any renewed weakness below the current price level at $4,015 would leave XAU/USD vulnerable to further downside extension below the psychological $4,000 demand area.
(The technical analysis of this story was written with the help of an AI tool. Know more.)
Open Interest, funding rate FAQs
Higher Open Interest is associated with higher liquidity and new capital inflow to the market. This is considered the equivalent of increase in efficiency and the ongoing trend continues. When Open Interest decreases, it is considered a sign of liquidation in the market, investors are leaving and the overall demand for an asset is on a decline, fueling a bearish sentiment among investors.
Funding fees bridge the difference between spot prices and prices of futures contracts of an asset by increasing liquidation risks faced by traders. A consistently high and positive funding rate implies there is a bullish sentiment among market participants and there is an expectation of a price hike. A consistently negative funding rate for an asset implies a bearish sentiment, indicating that traders expect the cryptocurrency’s price to fall and a bearish trend reversal is likely to occur.














