


Ripple and Stellar outlook: XRP stalls at key resistance, XLM rally loses steam
- XRP faces rejection from the 50-day EMA at $1.18 after breaking above the upper boundary of the falling channel.
- XLM extends its pullback on Tuesday after a slight decline the previous day.
- Mixed on-chain and derivatives data suggest traders remain cautiously optimistic despite the ongoing price correction.
Ripple (XRP) and Stellar (XLM) are trading under pressure on Tuesday as bulls lose steam. XRP faces rejection near key resistance, while XLM continues its pullback so far this week. Despite the ongoing correction, mixed on-chain and derivatives metrics suggest traders remain cautiously optimistic for these altcoins.
Mixed sentiment among derivatives traders
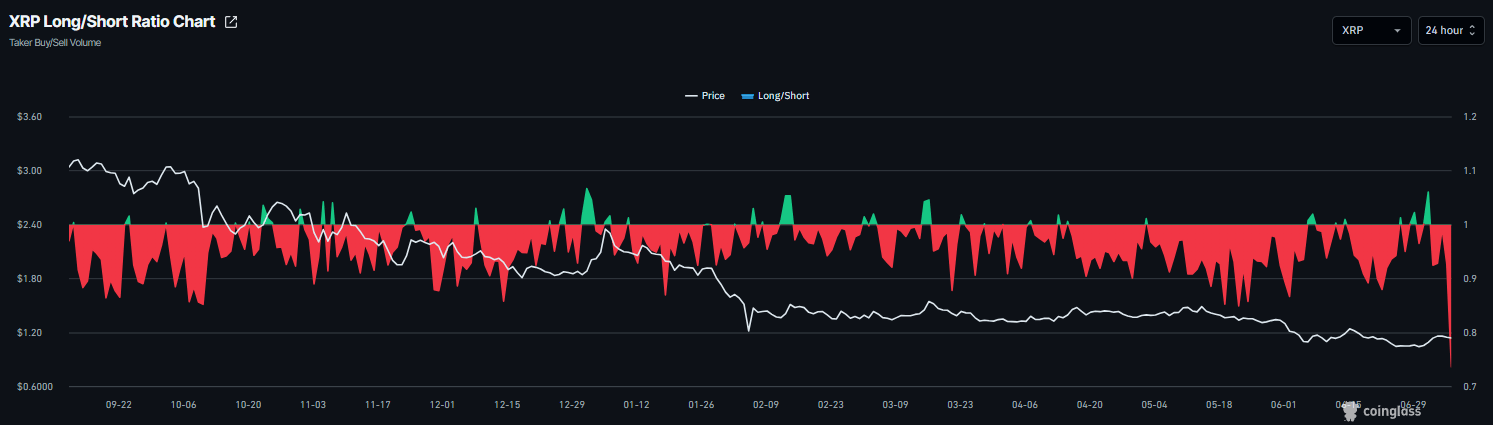
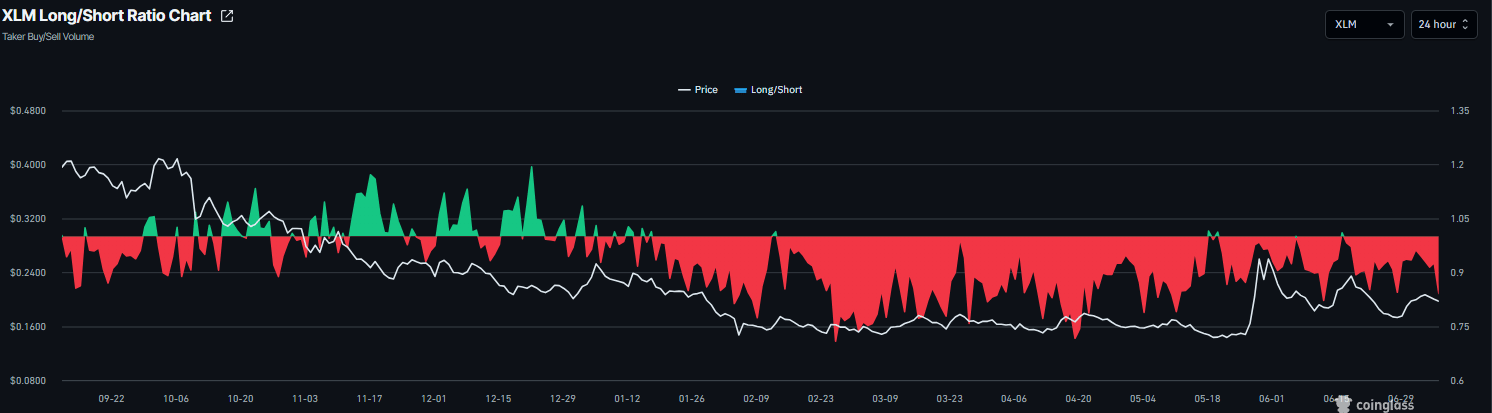
Derivatives data shows a mixed outlook. CoinGlass’ long-to-short ratio for XRP reads 0.73 on Tuesday, the lowest level over a month. During the same period, XLM's long-to-short ratio stands at 0.84, nearing the lowest level over a month. This ratio, being below 1, reflects bearish sentiment in the market, as more traders are betting the asset’s price will fall.

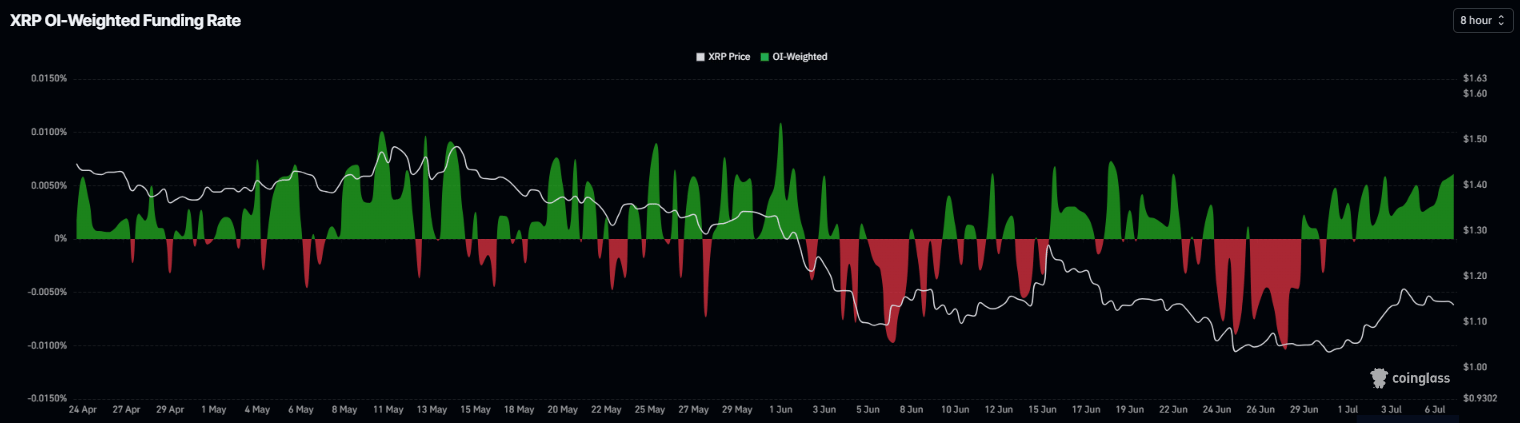
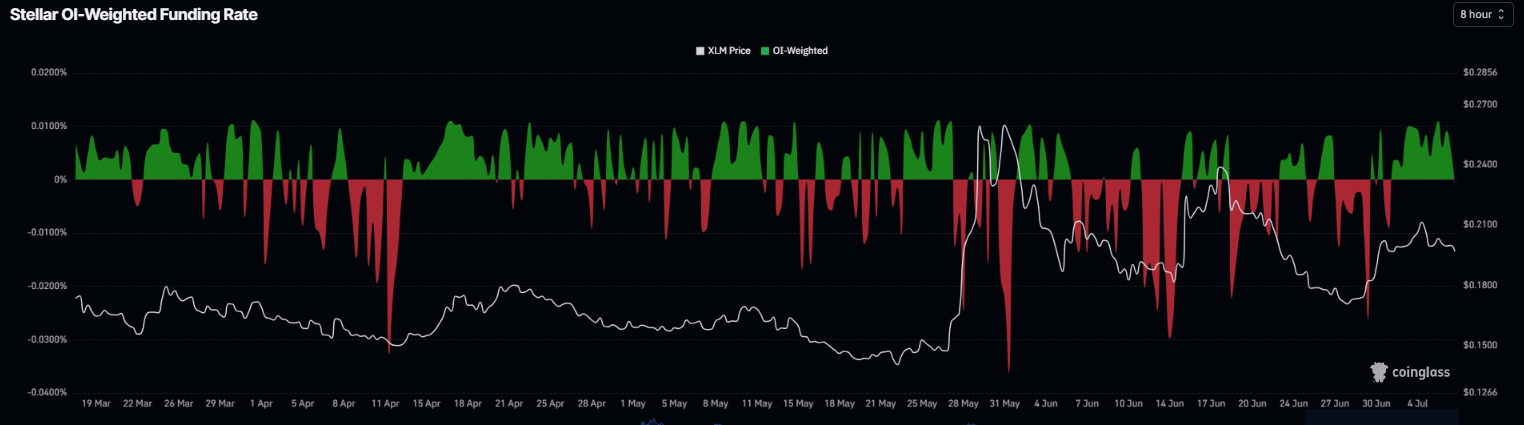
However, XRP and XLM funding rates remain positive, at 0.0061% and 0.0058%, respectively, on Tuesday. These positive rates indicate that longs are paying the shorts, suggesting bullish sentiment.
On-chain metrics show cautious optimism
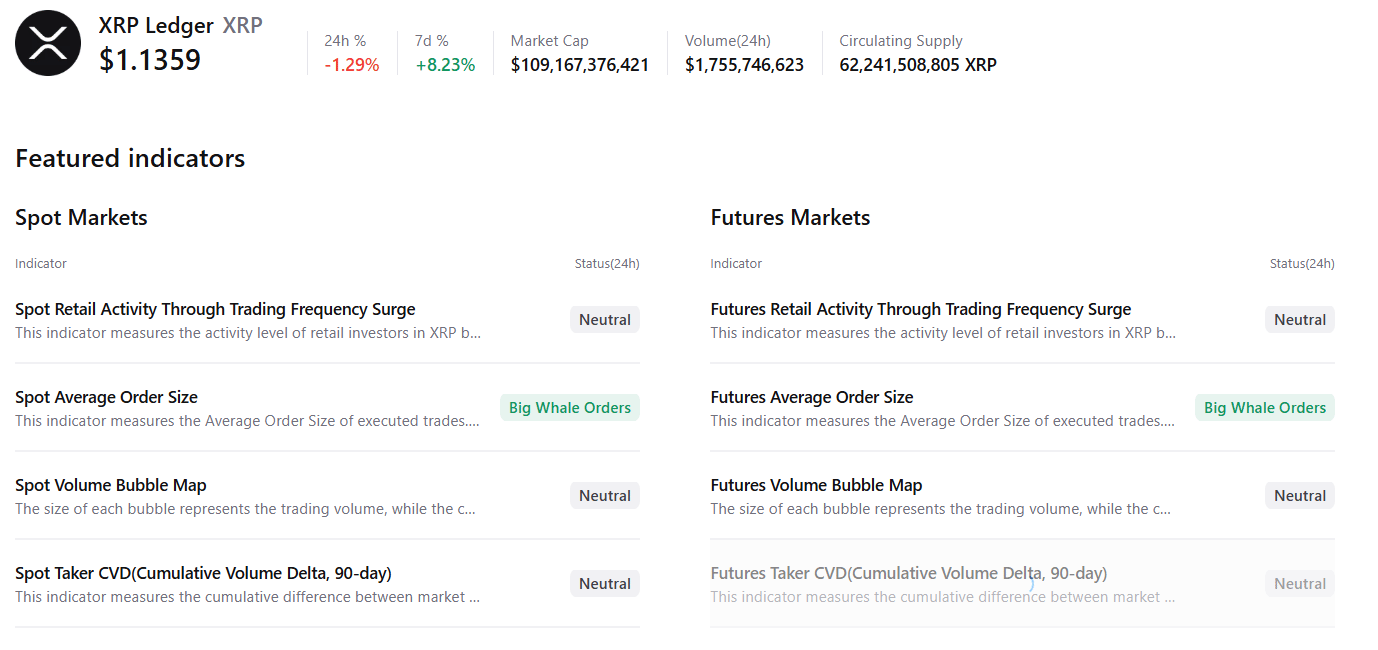
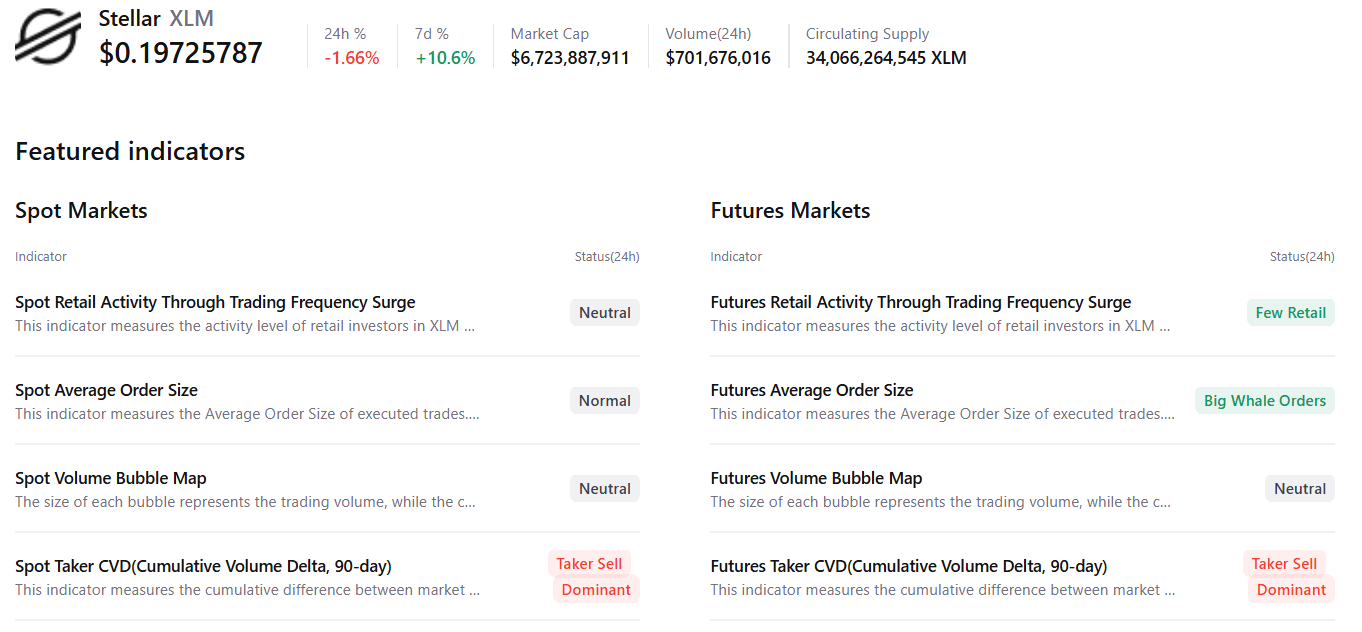
CryptoQuant’s summary data shows cautious optimism. XRP’s spot and futures markets show large-whale orders, with neutral conditions on other metrics, supporting a potential recovery. However, XLM shows selling-side dominance in both markets, with mixed retail activity and large-whale orders in the futures market, hinting at cautious sentiment among traders.
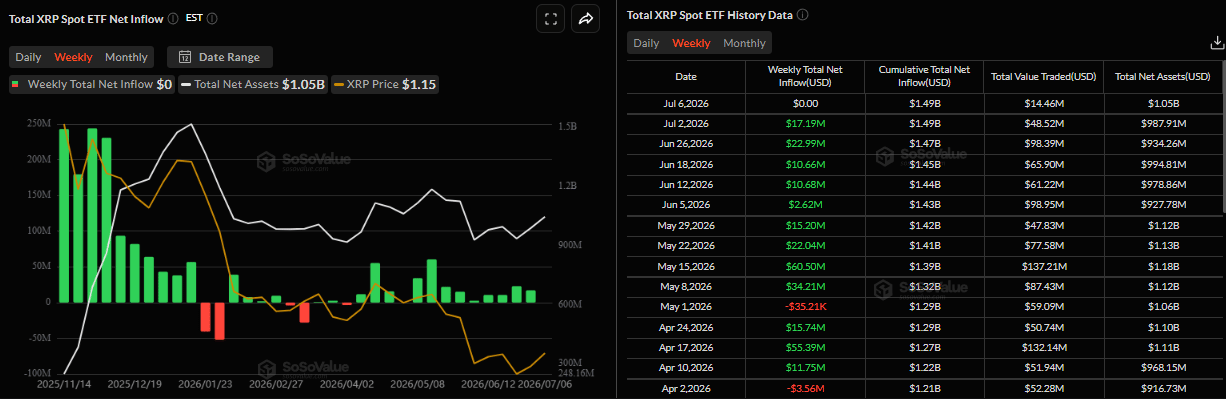
SoSoValue data shows institutional demand began the week with a neutral tone. Spot Exchange-Traded Funds (ETFs) were muted on Monday, following a net inflow of $17.19 million last week. If this inflow trend continues and intensifies this week, XRP could see a recovery ahead.
XRP technical outlook: Faces rejection from 50-day EMA
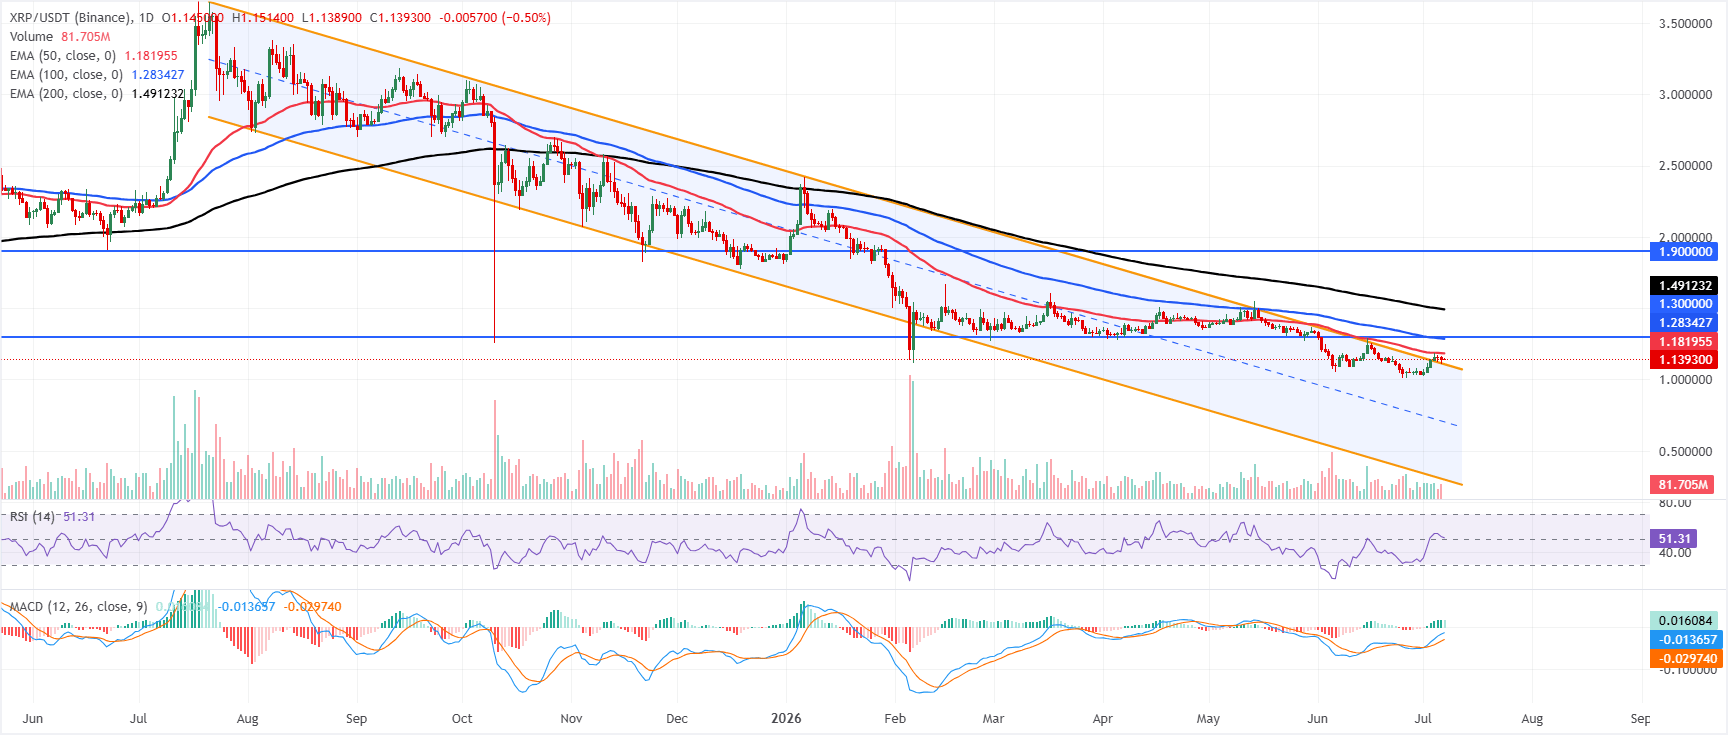
XRP price trades at $1.1393 on Tuesday, maintaining a bearish near-term tone as it remains below the 50-day Exponential Moving Average (EMA) at $1.1820, the 100-day EMA at $1.2834 and the longer-term 200-day EMA at $1.4912.
The downward parallel channel offers a modicum of structure, with price holding above its lower band around $1.1054, while the Relative Strength Index (RSI) hovers near a neutral 51, and the Moving Average Convergence Divergence (MACD) stays in positive territory but shows a slight loss of momentum, hinting at a capped recovery rather than a decisive trend reversal.
On the topside, immediate resistance emerges at the 50-day EMA at $1.1820, followed by the 100-day EMA at $1.2834 and the horizontal barrier at $1.3000, with the 200-day EMA at $1.4912 and the prior resistance line near $1.9000 marking higher hurdles for any sustained advance.
On the downside, initial support aligns with the lower boundary of the descending channel around $1.1054, and a clear break below this floor would reinforce the prevailing bearish bias and open the door to a deeper pullback in the coming sessions.
XLM technical outlook: Finds support around key levels
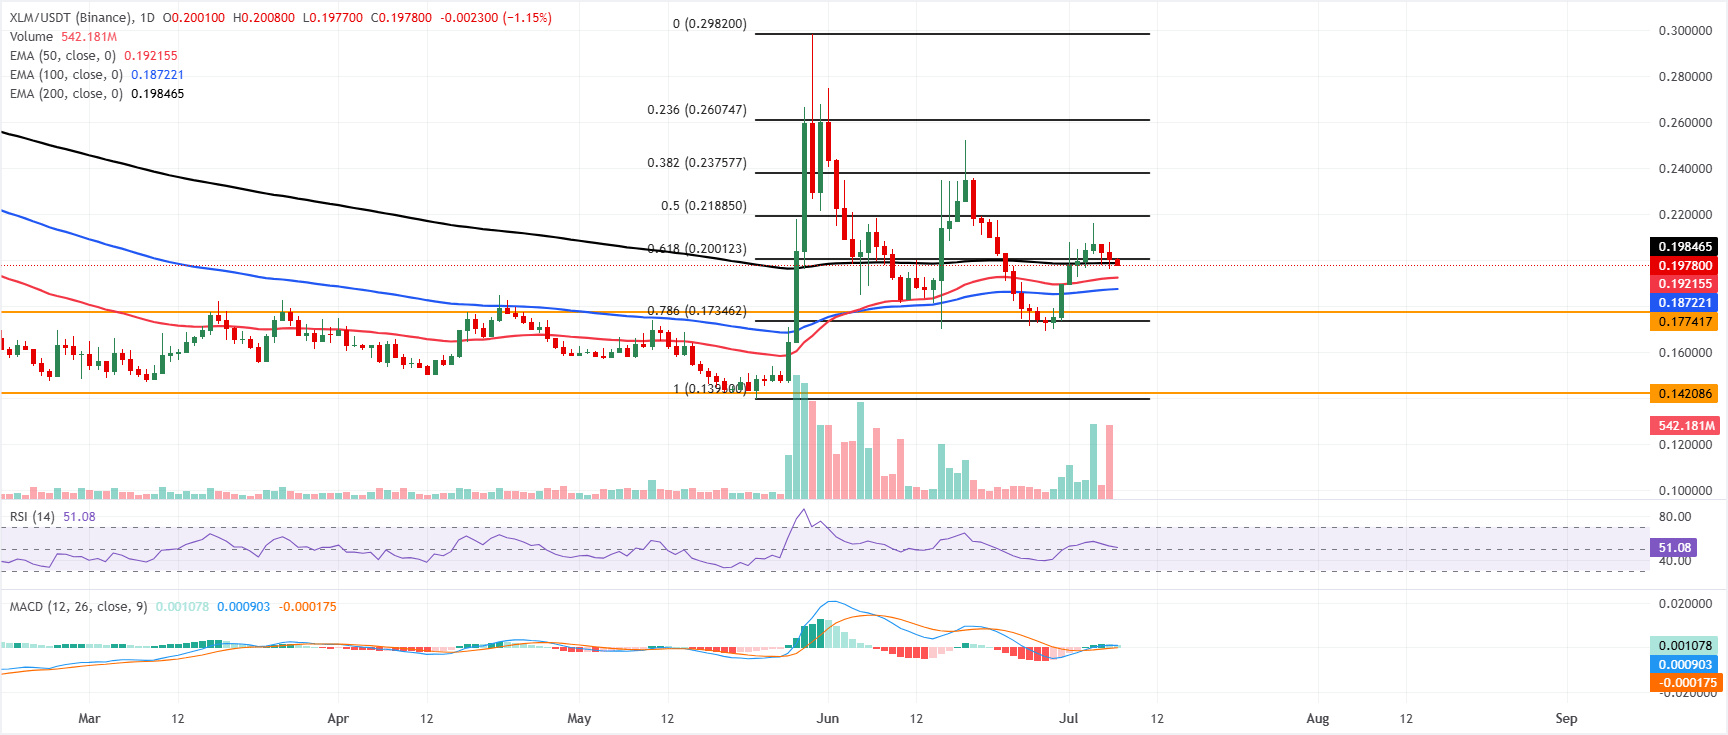
XLM price trades at $0.1978 on Tuesday, holding above the 50-day and 100-day EMAs at $0.1922 and $0.1872, reinforcing a mildly bullish near-term bias. The pair is still capped just underneath the 200-day EMA at $0.1985 and the 61.8% Fibonacci retracement at $0.2001, while the RSI around 51 and a positive MACD line above zero suggest steady but not overextended upside momentum.
On the topside, initial resistance is at the 200-day EMA at $0.1985, followed closely by the 61.8% Fibonacci retracement at $0.2001, with higher hurdles at $0.2188 and $0.2376 before the next Fibonacci barrier at $0.2607.
On the downside, immediate support is seen at the 50-day EMA at $0.1922, ahead of the 100-day EMA at $0.1872, while a horizontal level at $0.1774 and the 78.6% Fibonacci retracement at $0.1735 guard against a deeper pullback before the more distant structural floor near $0.1421.
(The technical analysis of this story was written with the help of an AI tool. Know more.)
Ripple FAQs
Ripple is a payments company that specializes in cross-border remittance. The company does this by leveraging blockchain technology. RippleNet is a network used for payments transfer created by Ripple Labs Inc. and is open to financial institutions worldwide. The company also leverages the XRP token.
XRP is the native token of the decentralized blockchain XRPLedger. The token is used by Ripple Labs to facilitate transactions on the XRPLedger, helping financial institutions transfer value in a borderless manner. XRP therefore facilitates trustless and instant payments on the XRPLedger chain, helping financial firms save on the cost of transacting worldwide.
XRPLedger is based on a distributed ledger technology and the blockchain using XRP to power transactions. The ledger is different from other blockchains as it has a built-in inflammatory protocol that helps fight spam and distributed denial-of-service (DDOS) attacks. The XRPL is maintained by a peer-to-peer network known as the global XRP Ledger community.
XRP uses the interledger standard. This is a blockchain protocol that aids payments across different networks. For instance, XRP’s blockchain can connect the ledgers of two or more banks. This effectively removes intermediaries and the need for centralization in the system. XRP acts as the native token of the XRPLedger blockchain engineered by Jed McCaleb, Arthur Britto and David Schwartz.














本网站提供的信息仅具有一般性质,不构成个人财务建议。在根据本网站上的任何信息采取行动之前,您应结合自身的目标、财务状况和需求,考虑该信息是否适合您。投资差价合约(CFD)和外汇保证金合约具有重大风险,并不适合所有投资者。您的亏损可能超过初始入金。您并不拥有,也不享有任何相关标的资产的权益。我们建议您寻求独立意见,并在交易前确保您已充分了解所涉及的风险。在购买本网站列出的任何产品之前,务必阅读并考虑相关披露文件。本网站提供的信息和广告并非面向任何在其所在国家或司法管辖区使用此类信息会违反当地法律法规的人士。本网站提供的产品和服务不面向美国、马来西亚和泰国居民。
TMGM 是由多家金融监管机构授权。
TMGM 集团下的 Trademax Australia Limited 公司(交易名称为TMGM),是由澳大利亚证券和投资委员(ASIC)监管的金融服务公司,金融服务牌照号为 436416,公司地址为 Level 28, One International Tower, 100 Barangaroo Avenue, 2000 Sydney, NSW Australia.
邮箱:support@tmgm.com.au
TMGM 集团下的 Trademax Global Limited公司(交易名称为TMGM),是由瓦努阿图金融服务委员会(VFSC)监管的金融服务公司,金融牌照号为 40356,注册地址为 1276, Kumul Highway, Port Vila, Vanuatu, Republic of Vanuatu.
邮箱:support@tmgm.com
Trademax Global Markets (SE) Limited,以 TMGM 名义经营,获塞舌尔金融服务管理局(FSA)授权并监管,许可证号为 SD224。公司注册地址为塞舌尔马埃岛 Providence Estate ABIS 中心13号办公室。
邮箱:support@tmgm.com
TMGM集团下的Trademax Global Markets (International) Pty Ltd公司(交易名称为TMGM),是由毛里求斯金融服务委员会监管的金融服务公司. 牌照号为 GB22201012,注册地址为33, Edith Cavell Street C/o IQ EQ Fund Services (Mauritius) Ltd Port Louis, 11324 Mauritius.
邮箱:support@tmgm.com
版权所有 © TMGM。保留所有权利