

Bitcoin Price Forecast: BTC retreats as Middle East conflict overshadows ETF inflows
- Bitcoin trades lower on Monday, falling below $63,000 after a mild recovery in the previous week.
- Renewed tensions in the Middle East escalated after the US launched fresh strikes on Iran on Sunday, weighing on risk sentiment and capping BTC.
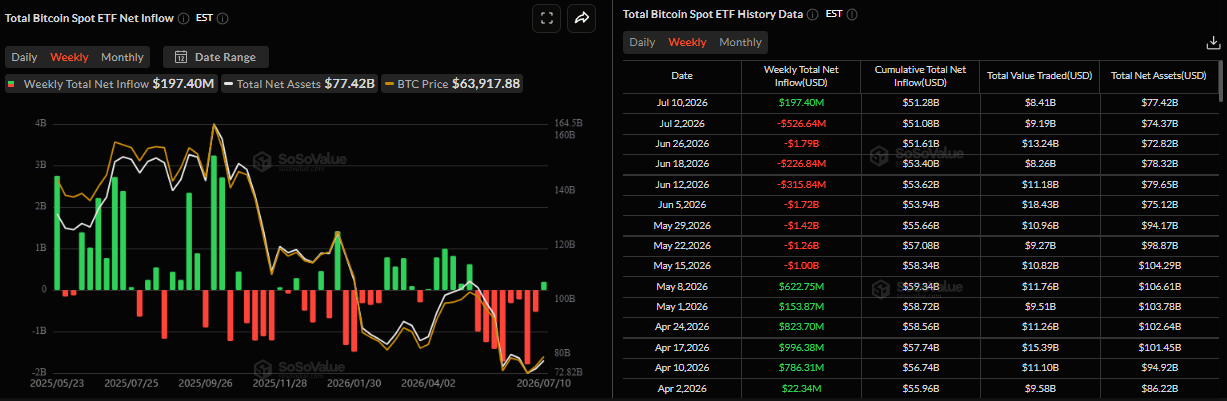
- Spot ETFs recorded a net inflow of $197 million last week, ending the eight-week streak of outflows.
Bitcoin (BTC) struggles to hold above $64,000 on Monday after a modest recovery the previous week. Risk sentiment dampens as tensions in the Middle East escalated after the US launched fresh strikes on Iran on Sunday, weighing on BTC. Meanwhile, improving institutional demand, with spot Bitcoin Exchange Traded Funds (ETFs) ending an eight-week streak of net outflows, has provided only limited support amid rising geopolitical uncertainty.

Geopolitical risk premium caps BTC
The US military stated that the strikes began at 5 pm New York time on Sunday. US Central Command (CENTCOM) reported that US forces struck Iranian military air-defense systems, coastal radar sites, missile and drone capabilities, and small boats using US fighter aircraft, naval vessels, one-way attack aerial drones, and one-way attack sea drones for the first time.
Iranian media reported several explosions near Sirik and west of Bandar Abbas within minutes of the strikes beginning, followed shortly after by further explosions around Qeshm and Jask, both close to key military infrastructure on the Strait of Hormuz.
Moreover, Iran’s Islamic Revolutionary Guard Corps (IRGC) fired at another commercial vessel in the Strait of Hormuz and announced the closure of the critical waterway, prompting traders to price in a geopolitical risk premium.
Global markets begin the week on a risk-off footing as renewed tensions between the US and Iran dampened investor sentiment. Rising geopolitical uncertainty pushed West Texas Intermediate (WTI) crude oil prices above $75 per barrel, while risk assets such as BTC came under pressure, slipping below $63,000 on Monday.
Institutional demand shows signs of improvement
Institutional demand shows mild signs of improvement. The SoSoValue data below shows that Bitcoin spot ETFs recorded an inflow of $197.40 million last week, ending the eight-week streak of outflows since mid-May. However, the positive flows provided only limited support for Bitcoin as renewed geopolitical tensions continue to weigh on market sentiment.
Bitcoin Price Forecast: The $64,000 resistance holds strong
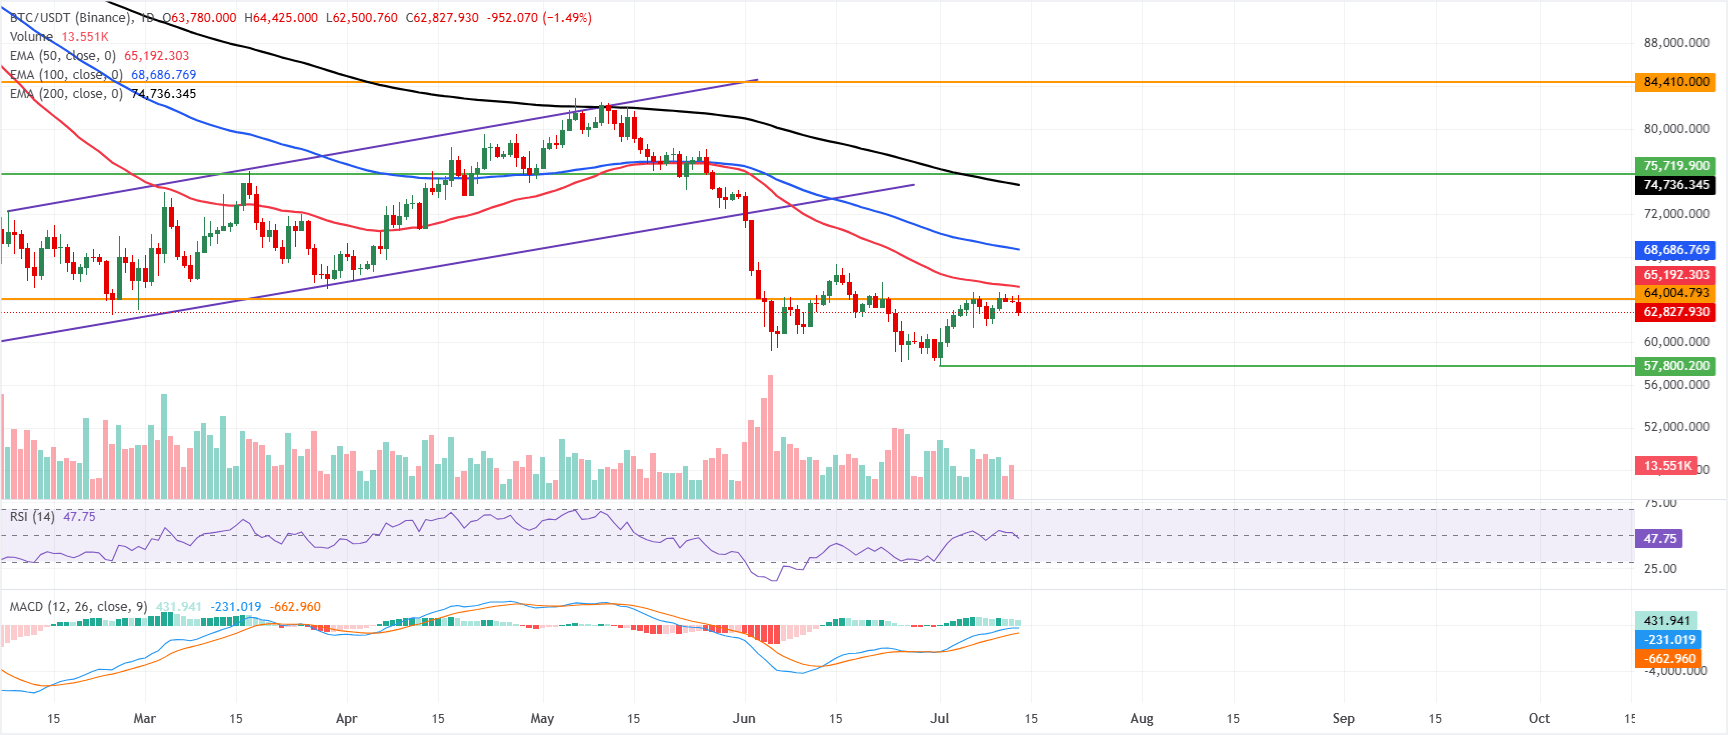
Bitcoin price trades at $62,827 at the time of writing on Monday, following a mild recovery in the previous week. BTC maintains a bearish near-term tone, remaining below the key Exponential Moving Averages (EMAs). Price remains below the 50-day EMA at $65,192, the 100-day EMA at $68,686, and the 200-day EMA at $74,736, suggesting that a well-defined overhead supply zone continues to constrain rallies.
The Relative Strength Index (RSI) is hovering just below the midline on the daily chart on Monday. At the same time, the Moving Average Convergence Divergence (MACD) remains in positive territory, suggesting that downside momentum is moderating but that the broader structure is still capped by overhead supply.
On the topside, initial resistance emerges at the horizontal barrier near $64,004, where recent price action is already struggling to gain traction. Beyond that, the 50-day EMA at $65,192 is the next hurdle, followed by the 100-day EMA at $68,686 and the 200-day EMA at $74,736, before a more distant horizontal resistance stands around $84,410.
On the downside, the lack of clearly defined nearby support levels in this setup leaves the pair vulnerable to renewed selling should momentum fade, with traders likely to look to the $60,000 key psychological level on the chart for potential demand zones.
(The technical analysis of this story was written with the help of an AI tool. Know more.)
Bitcoin, altcoins, stablecoins FAQs
Bitcoin is the largest cryptocurrency by market capitalization, a virtual currency designed to serve as money. This form of payment cannot be controlled by any one person, group, or entity, which eliminates the need for third-party participation during financial transactions.
Altcoins are any cryptocurrency apart from Bitcoin, but some also regard Ethereum as a non-altcoin because it is from these two cryptocurrencies that forking happens. If this is true, then Litecoin is the first altcoin, forked from the Bitcoin protocol and, therefore, an “improved” version of it.
Stablecoins are cryptocurrencies designed to have a stable price, with their value backed by a reserve of the asset it represents. To achieve this, the value of any one stablecoin is pegged to a commodity or financial instrument, such as the US Dollar (USD), with its supply regulated by an algorithm or demand. The main goal of stablecoins is to provide an on/off-ramp for investors willing to trade and invest in cryptocurrencies. Stablecoins also allow investors to store value since cryptocurrencies, in general, are subject to volatility.
Bitcoin dominance is the ratio of Bitcoin's market capitalization to the total market capitalization of all cryptocurrencies combined. It provides a clear picture of Bitcoin’s interest among investors. A high BTC dominance typically happens before and during a bull run, in which investors resort to investing in relatively stable and high market capitalization cryptocurrency like Bitcoin. A drop in BTC dominance usually means that investors are moving their capital and/or profits to altcoins in a quest for higher returns, which usually triggers an explosion of altcoin rallies.














