

Crypto Overview: Bitcoin holds $77,000 as mid-tier tokens rally on hopes of US-Iran deal
- Bitcoin hovers above $77,000 on Monday after two consecutive days of recovery.
- Oil prices drop below $92, with a bearish gap opening on Monday amid hopes that Strait of Hormuz will reopen.
- Mid-tier crypto tokens DeXe, Stable, and Humanity lead the rally with double-digit gains over the last 24 hours.
Bitcoin (BTC) holds above $77,000 at press time on Monday, while mid-tier crypto tokens DeXe (DEXE), Stable (STABLE), and Humanity (H) post double-digit gains over the last 24 hours, likely driven by renewed hopes that the Strait of Hormuz will reopen.
Hopes of US-Iran deal ease downside pressure across markets

The ongoing peace talks between the US and Iran have renewed hopes that the Strait of Hormuz will reopen, as previously reported by FXStreet. West Texas Intermediate (WTI) – the US oil benchmark – opened with a bearish gap below $92 on Monday, while Japan’s Nikkei is up roughly 3% as tensions in the Middle East ease.
Institutional demand for crypto could revive as falling oil prices cap US inflation, boosting risk appetite for Bitcoin and other tokens. SoSoValue data shows Bitcoin and Ethereum (ETH)-focused Exchange Traded Funds (ETFs) recorded roughly $1.26 billion and $216 million in outflows last week, respectively, while Hyperliquid (HYPE) led institutional demand with $72 million in inflows.
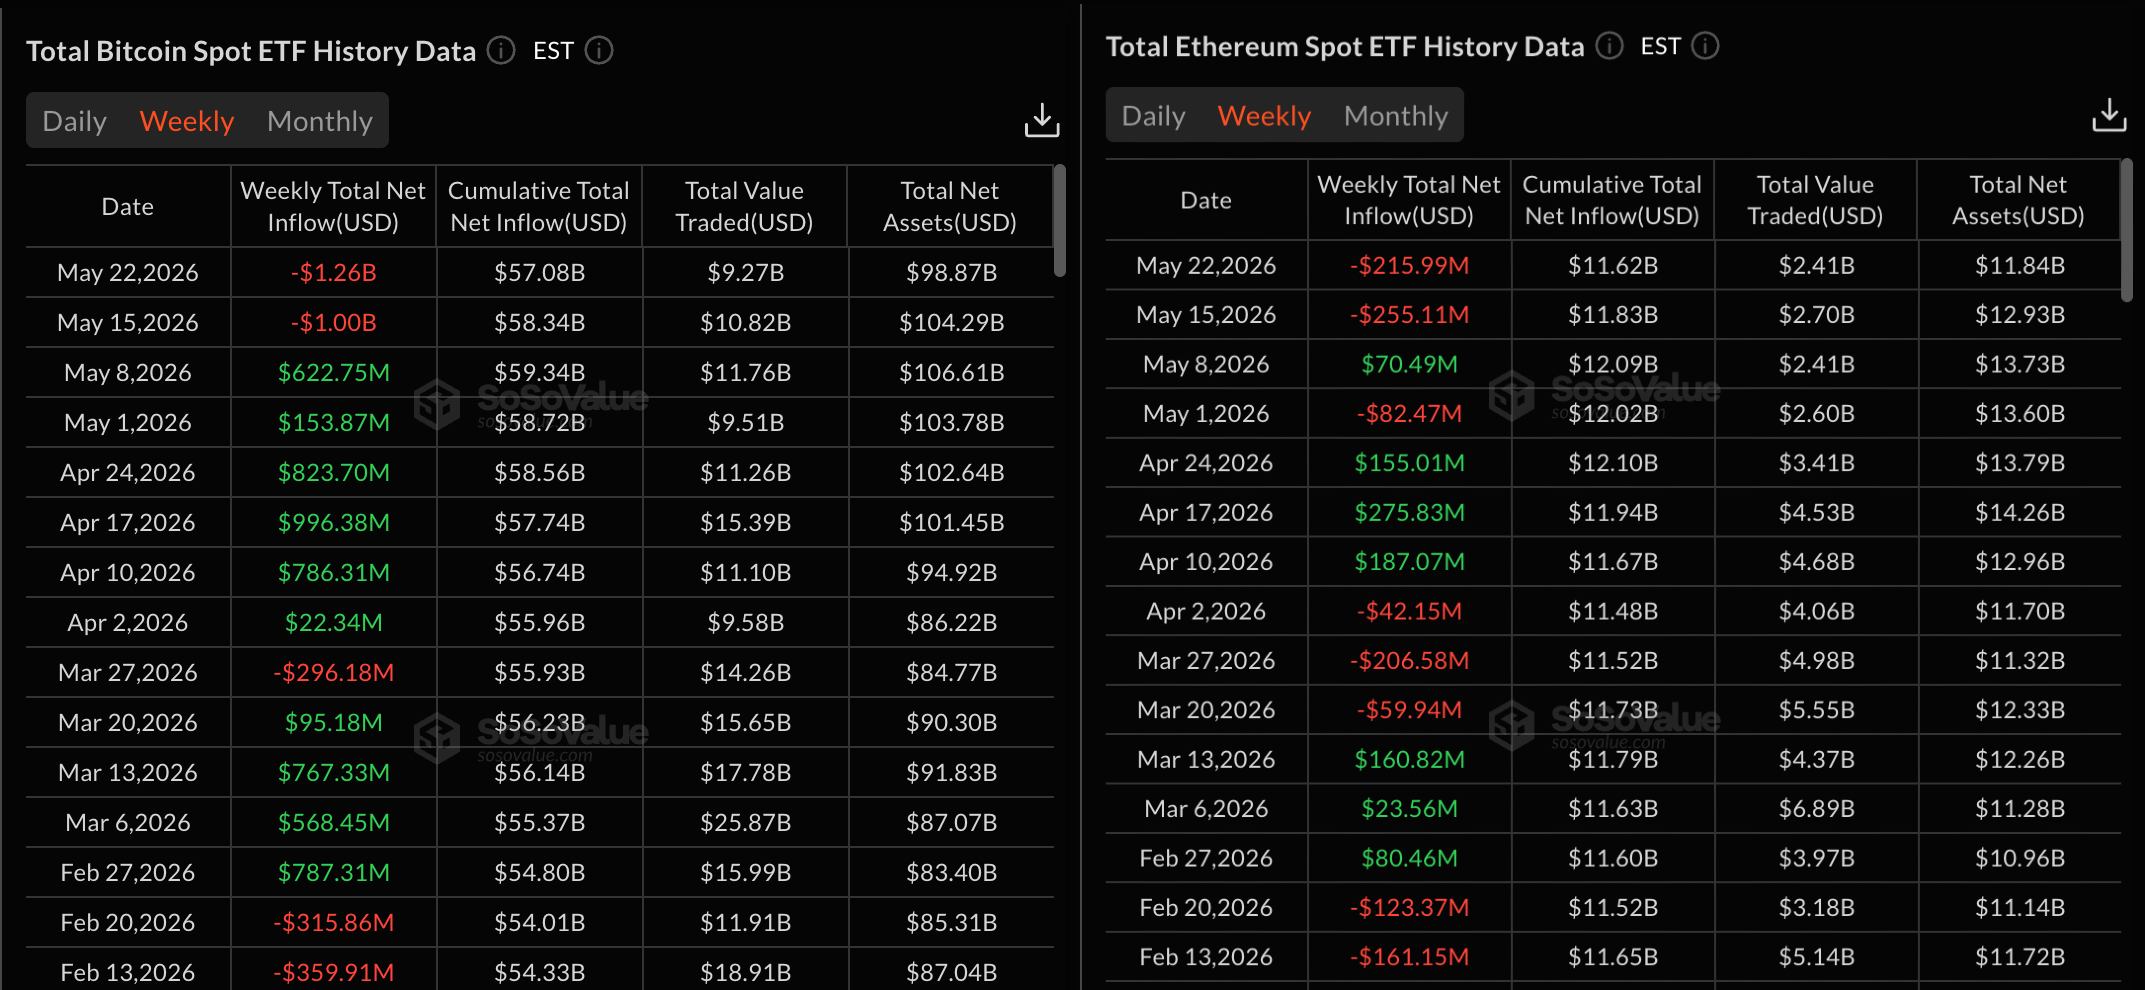
A potential US-Iran deal could uplift risk-on sentiment across the broader crypto market, driving a rally in Bitcoin and other crypto assets. Over the last 24 hours, mid-tier crypto tokens have been leading the rally.
Technical outlook: Will DeXe, Stable, and Humanity extend the rebound?
DEXE trades above $15.00 at the time of writing on Monday, holding steady after a 12% jump the previous day. The token maintains a clear bullish bias, with price holding well above the 50-day Exponential Moving Average (EMA) at $11.78 and the 100- and 200-day EMAs at $9.68 and $8.12, respectively, reinforcing a medium-term uptrend.
Momentum remains constructive, with the Relative Strength Index (RSI) near 68 approaching overbought territory and the Moving Average Convergence Divergence (MACD) line rising in positive territory above its signal line, hinting that buyers still have the upper hand even if upside could become increasingly stretched.
The next notable resistance aligns with the prior cycle high at $16.24 on April 19, where bulls may face a more meaningful test.
On the downside, initial support is located at the 78.6% Fibonacci retracement at $14.87, measured from $16.24 to $9.81, followed by a deeper cushion at the 50% retracement around $13.03.
Stable extends gains by over 4% at press time on Monday, following an 8% rise the previous day. The stablecoin protocol token maintains a bullish near-term bias, with price holding well above the 50-day EMA at $0.0327 and the 100-day EMA at $0.0291, reinforcing a constructive underlying trend.
The upward-sloping trendline support connecting the December 24 and April 20 lows near $0.0298 remains comfortably below spot and underpins the broader advance.
Momentum is mixed but broadly supportive: the RSI at 60 hints at sustained buying interest, while the uptick in MACD prepares for a bullish crossover with its signal line, suggesting fresh upside pressure.
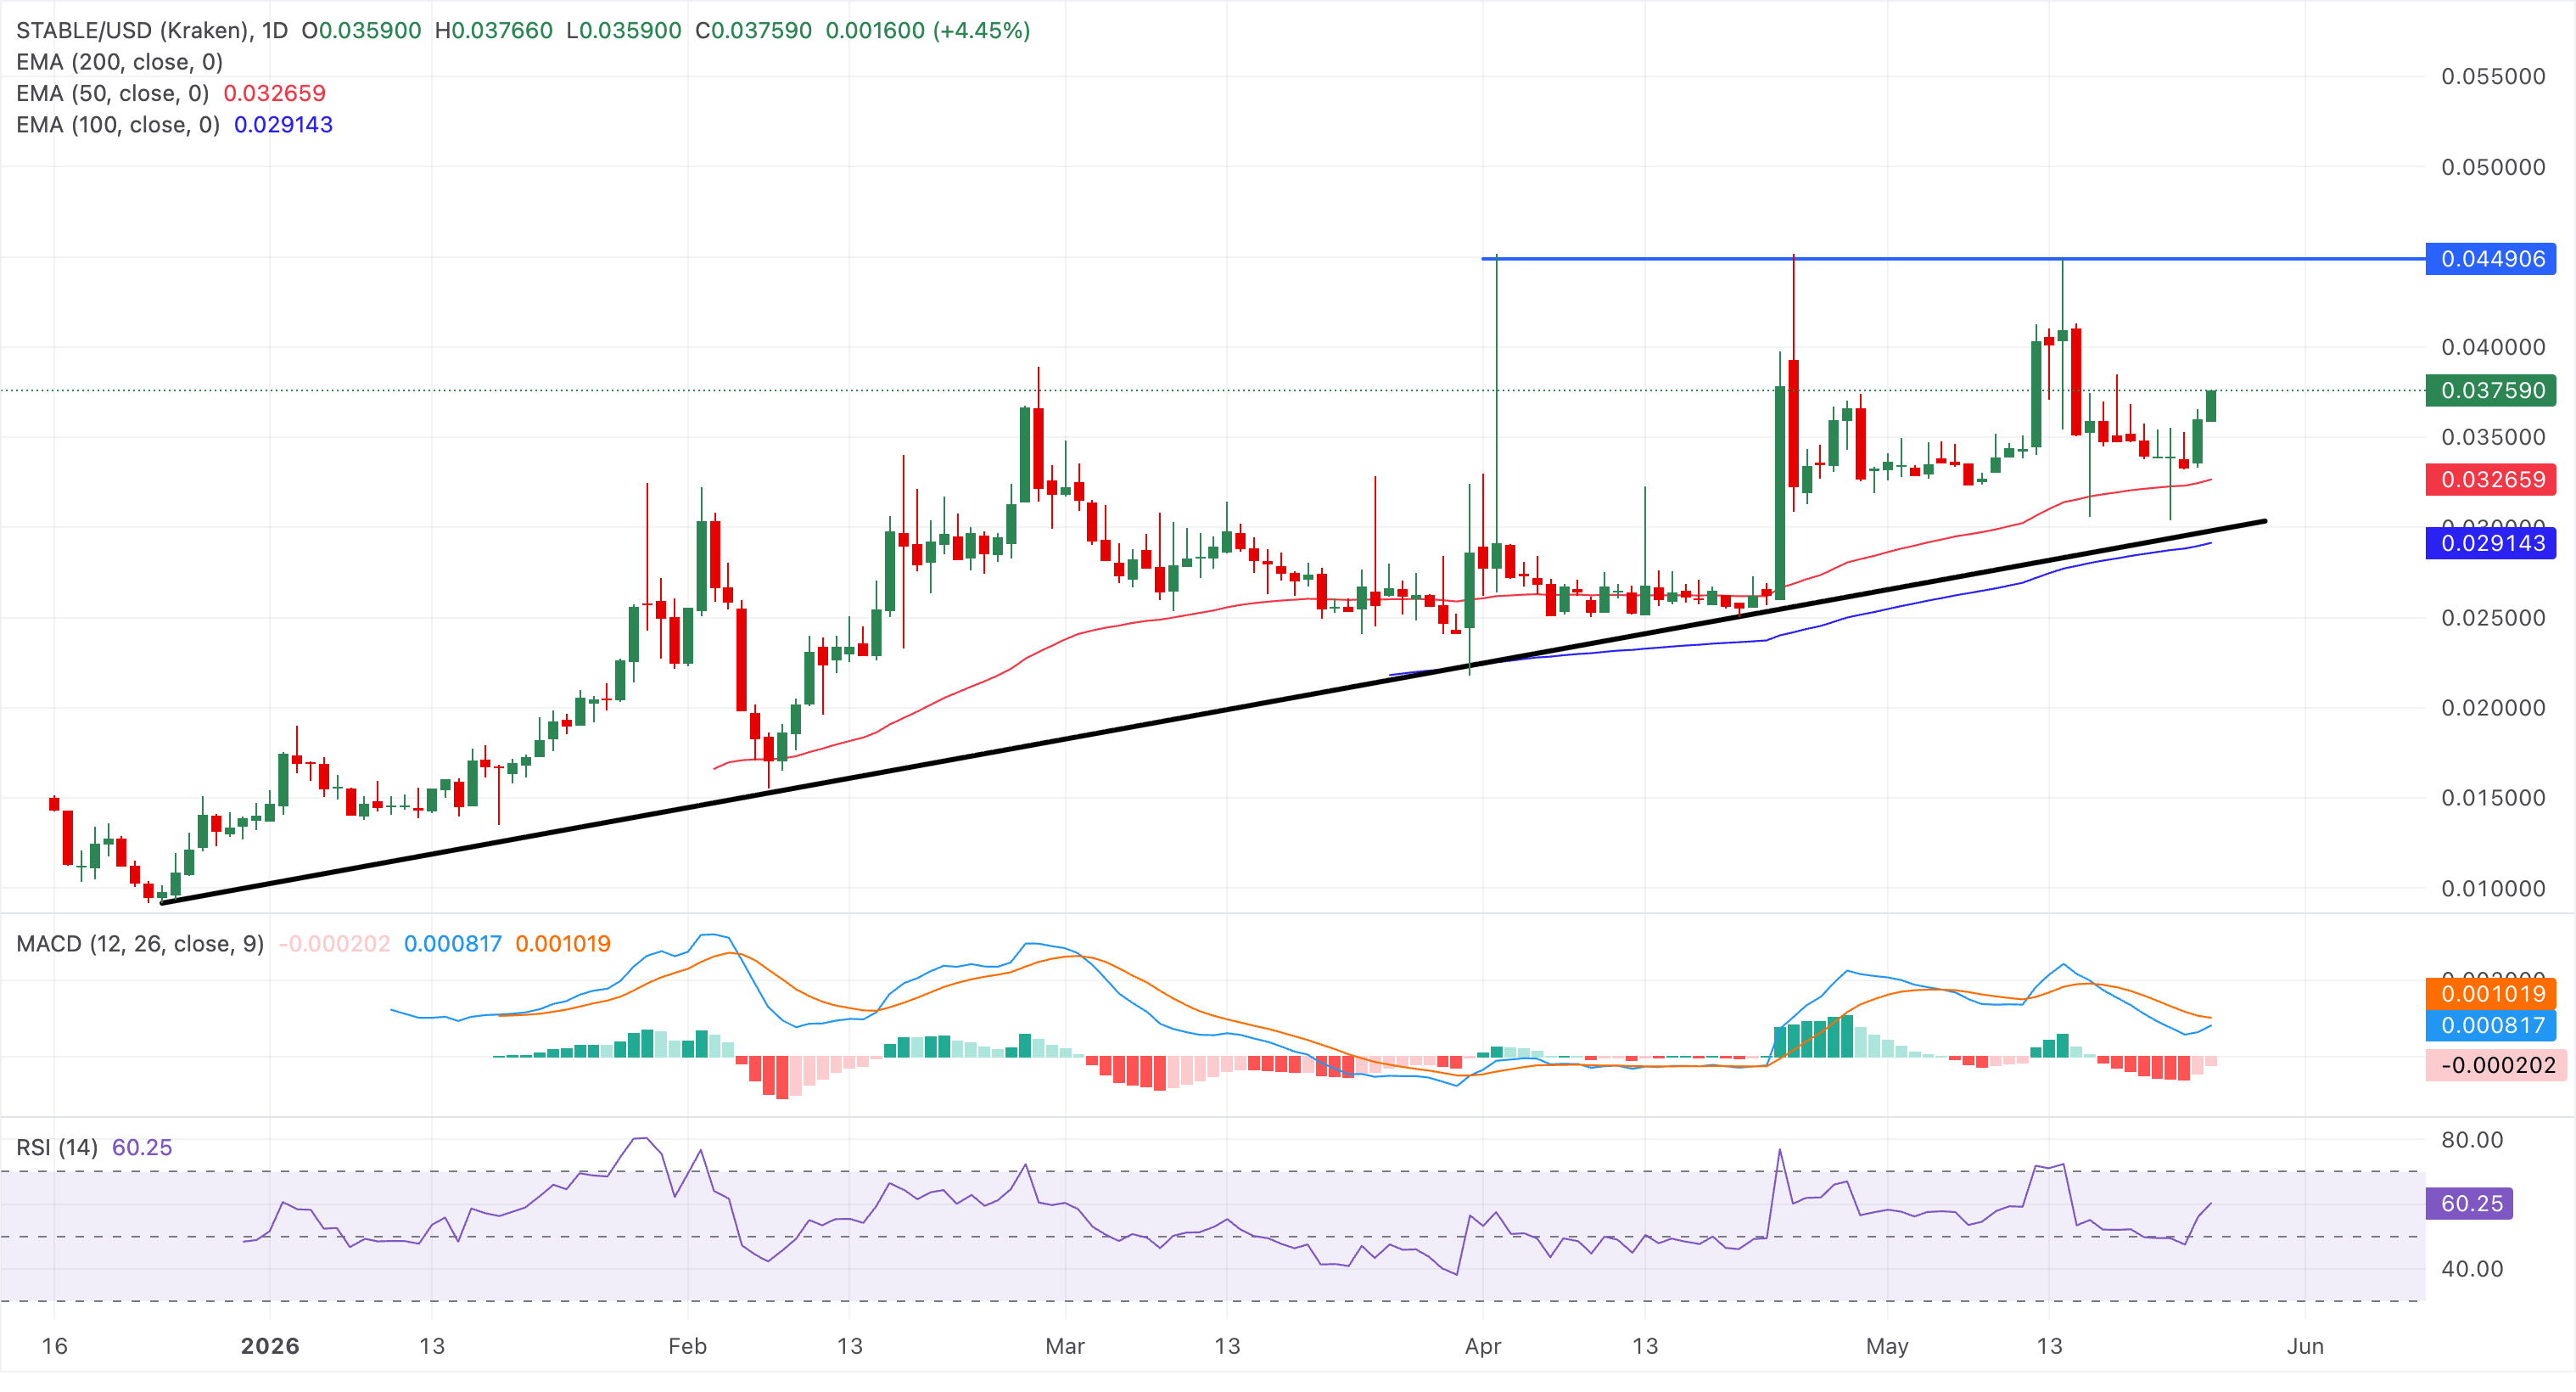
Looking up, the $0.04490 level has capped multiple bullish spikes and serves as the upside resistance.
Humanity token extends its third consecutive day of recovery at press time on Monday. The privacy- and biometric-focused token holds well above the 50-, 100-, and 200-day exponential moving averages (EMAs) at $0.1876, $0.1649, and $0.1551, respectively, keeping the near-term bias constructive despite the recent pullback from the $0.26 area.
The RSI around 55 on the daily chart rebounds from the midline but remains within a broader downtrend, while the MACD prepares for a bullish crossover, suggesting a mild cool-off in downside momentum.
Initial support emerges at the 50-day EMA near $0.1875, where a corrective dip could find buyers on a first test, followed by deeper demand around the 100-day EMA at $0.1649.
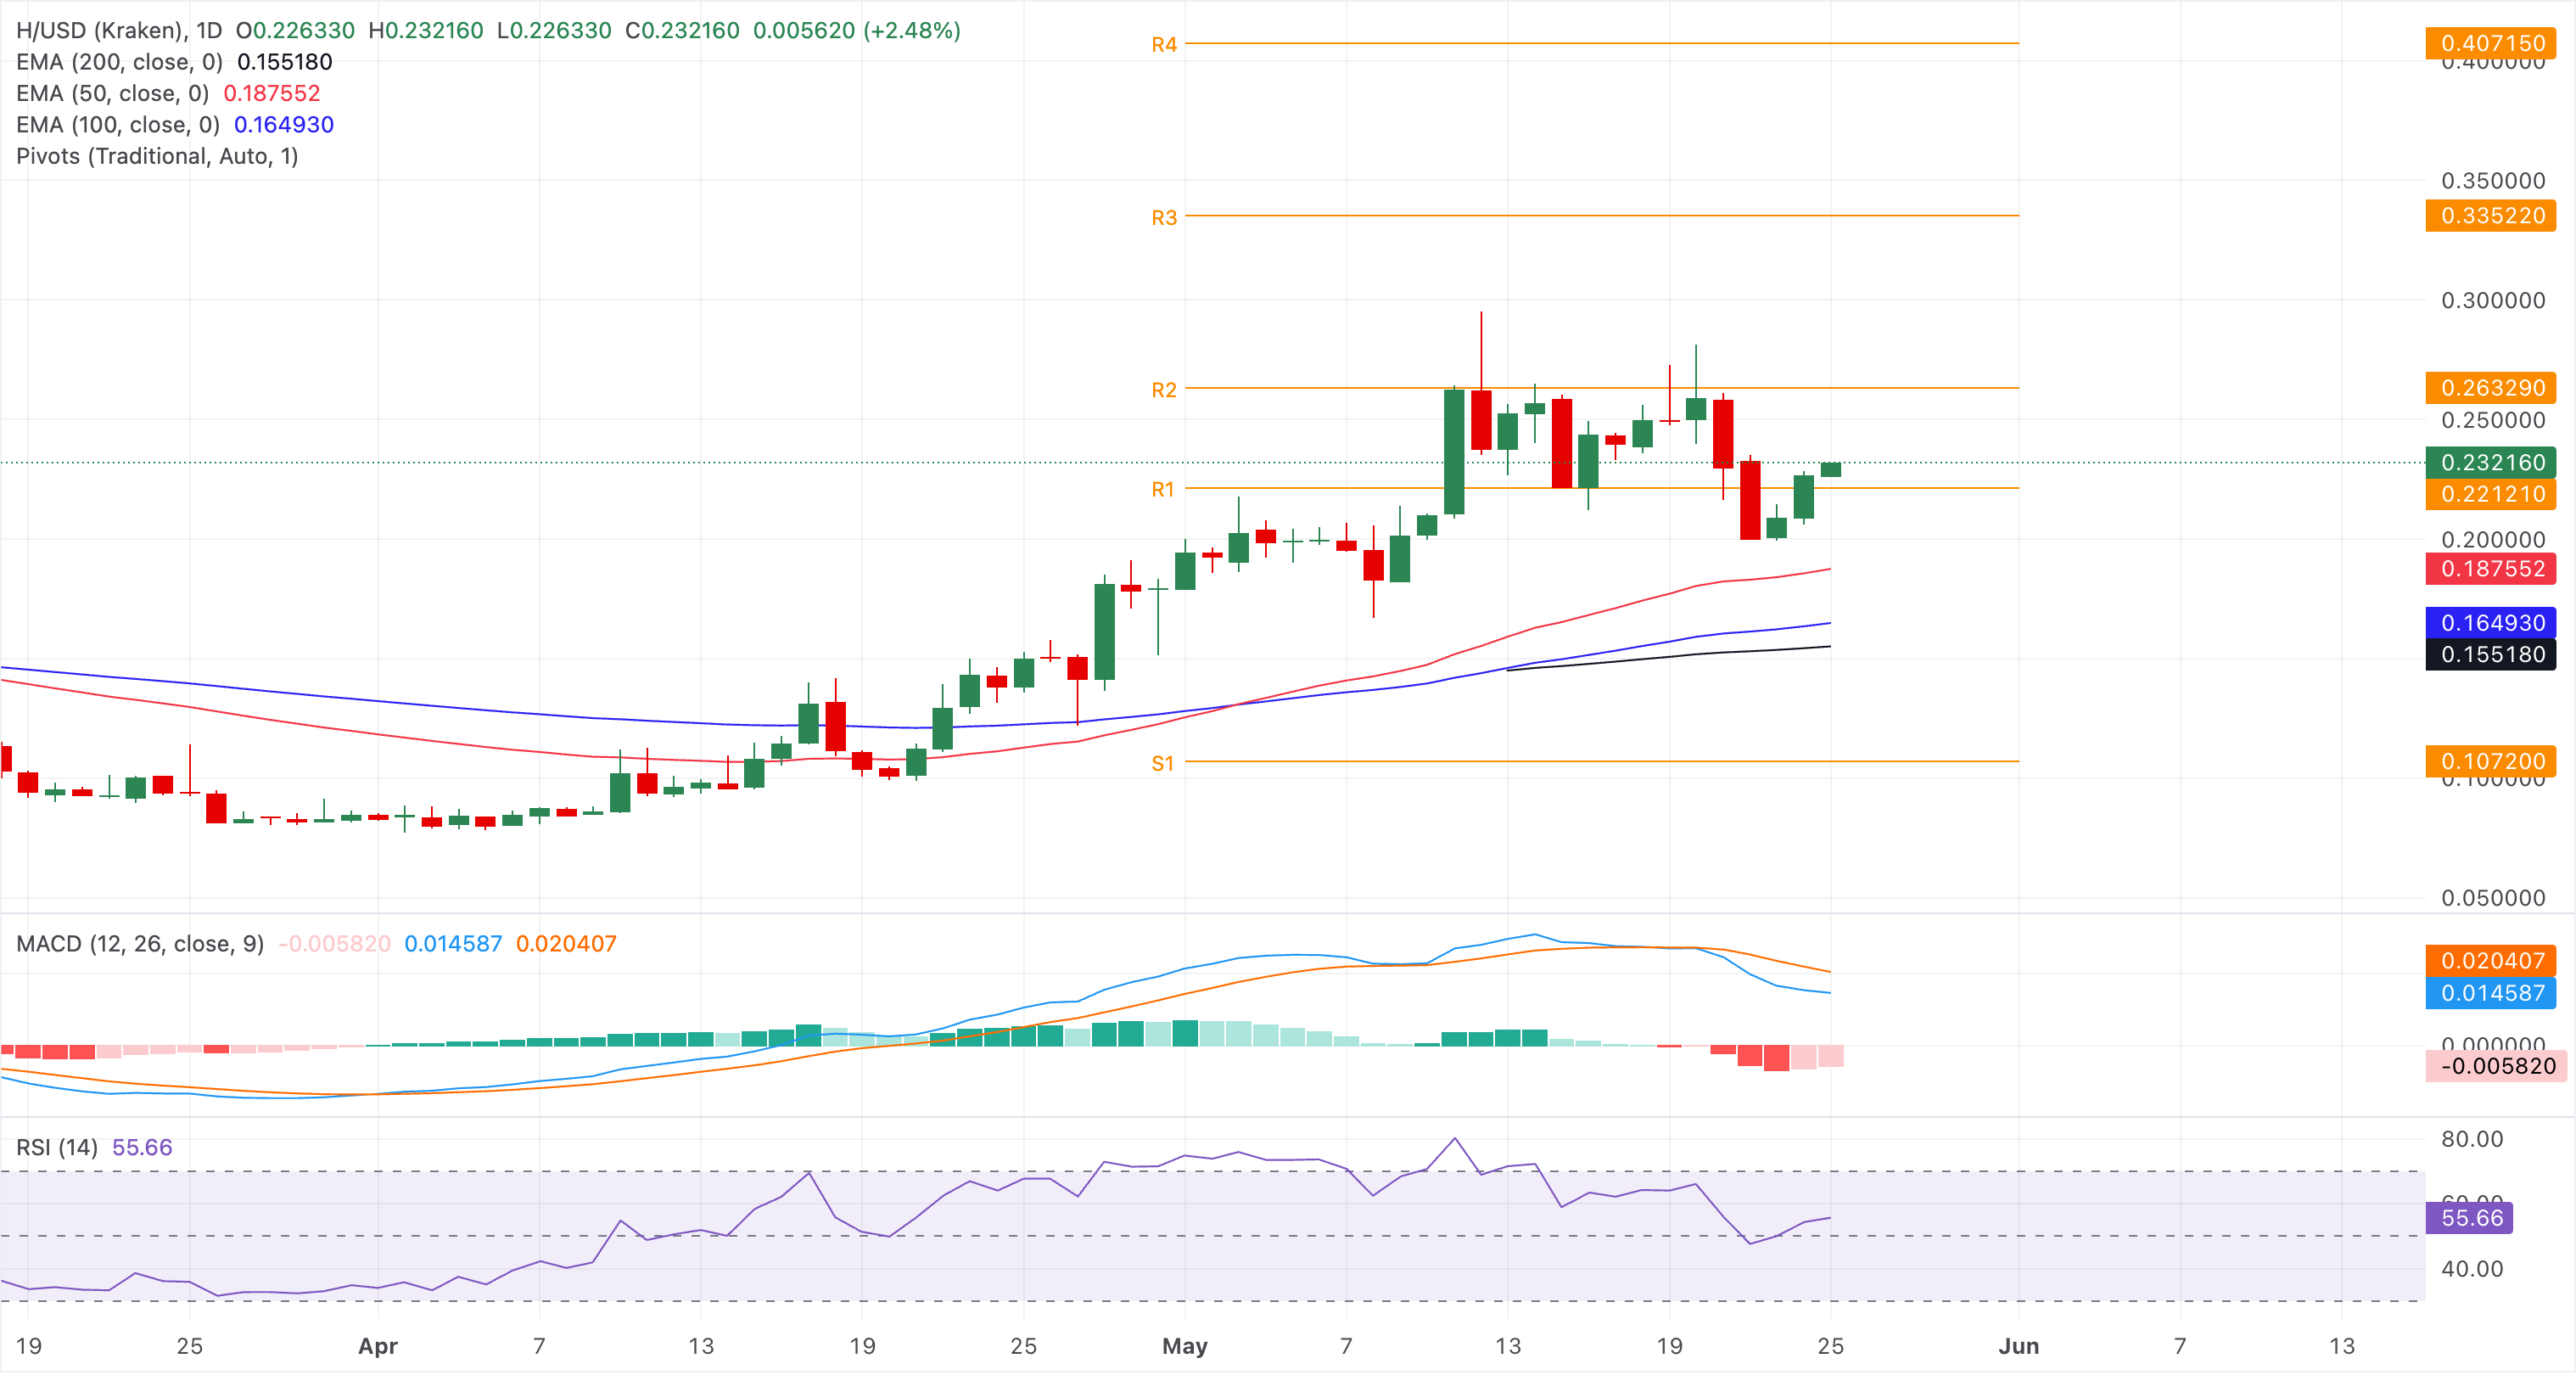
The S2 Pivot Point at $0.2632 served as the upside barrier that capped the recovery earlier this month, followed by the S3 Pivot Point at $0.3352, which is the next key resistance.
(The technical analysis of this story was written with the help of an AI tool.)














