

The Dow Jones Industrial Average buys a rumour and sleeps through a tariff regime
- DJIA trades near 52,000, around 325 points higher on the session, clawing back part of Thursday's slide on a wire report that Pakistan is exploring a route back to stalled US-Iran talks.
- A replacement tariff schedule took effect at 12:01 a.m. Friday, 10% to 12.5% on 60 trading partners covering 99% of American imports, on a legal basis built to survive the courts.
- The Federal Open Market Committee decides Wednesday with no projections attached, a 64.2% hold priced against a 35.8% hike tail, the widest of the cycle.
The index that spent this week absorbing a war premium trades near 52,000 on Friday, around 325 points to the good side, on the strength of a wire report that its own three sources undercut in the same breath. Pakistan is exploring a route back to stalled US-Iran talks at China's urging, and those sources cautioned that the obstacles to any American engagement remain high. Crude Oil sold off roughly 4% on the story, with Brent easing toward $96.00 after this week's move above $100.00 and West Texas Intermediate near $88.50.

Every de-escalation headline of this war has been retraced, in April, in May and again in early July, and the market has bought each one on first print. What separates this version is that the equity bid arrived on the same morning the trade regime changed underneath it, and almost nobody marked the second event.
A rally on three sources and a caveat
Apple (AAPL) supplied a large share of the index gain with a 3% move, which is what a price-weighted average does when a high-priced component catches a bid. Beneath the headline the tape was thinner than it looks, with every S&P 500 sector higher and real estate and communication services leading, while the semiconductor complex took real punishment.
The reversal in Intel (INTC) carries more information than the index gain does, because a second-quarter beat that gets sold 4% on spending concerns is the same trade that took Alphabet (GOOGL) down 6% on Thursday. Micron Technology (MU) fell 5%, Broadcom (AVGO) around 2% and Advanced Micro Devices (AMD) around 1%, and the benchmark chip fund gave up 2%. The Dow's insulation from that argument is structural rather than clever, since its chip weighting is a fraction of the Nasdaq's and most of its members still sell physical goods to physical customers.
The tariff schedule that landed while nobody looked
The temporary 10% worldwide levy expired at 12:01 a.m. Friday and was replaced by duties of 10% to 12.5% on 60 trading partners accounting for 99% of American imports, imposed under Section 301 of the Trade Act of 1974 on the charge that those partners have inadequately enforced bans on goods made with forced labour. Canada, the European Union, India and the United Kingdom draw the lower rate. China, Japan and South Korea draw the higher one.
The mechanism matters more than the headline rate does. February's Supreme Court defeat struck down the emergency-powers tariffs and forced the stopgap that lapsed overnight, and the replacement rests on a statute with a long record of surviving challenge. A duty schedule that endures is an input cost that endures, and June import prices were already running 7.1% YoY, the largest annual increase since August 2022, in an index that excludes tariffs outright. The exporters are not absorbing this, which means the domestic buyer is, which means the passthrough arrives with a lag on the desk of a committee that meets in five days.
What the bond market handed back
The Treasury market's answer to the same rumour amounts to a rounding error against the week it just had. The 10-year yield eased to around 4.67% from Thursday's print above 4.70%, its highest since January 2025, while the two-year sits near 4.33% and the long bond just above 5.15%. Three basis points of relief against a month that added roughly thirty is not a change of mind. It reads as a position trim into a weekend with a central bank meeting on the other side of it.
Rate pricing tells the story with more precision than the tape does. The July contract carries a 64.2% hold against a 35.8% hike tail, the widest July tail of this cycle and up from roughly 14% a week ago. Cumulative odds of at least one increase run 82.7% by 16 September and 92.7% by 9 December, with a 61.0% probability of two by that date and a 39.0% modal cell at 4.00% to 4.25%. Equities are trading a peace rumour, and the curve is trading a hiking cycle.
Wednesday is a communication event, not a policy event
The Federal Open Market Committee announces at 18:00 GMT on Wednesday with no Summary of Economic Projections attached, which strips the meeting of the machinery markets normally use to reprice it. The statement now runs to roughly 130 words, forward guidance was struck in June, and the chair has already declined once to publish a projection of his own. What remains tradeable is the press conference at 18:30 GMT, and the language it uses about energy passthrough.
That thin surface is the risk rather than the comfort for an index sitting roughly 2.5% below its record. A hold delivered with harder inflation language does not land on Wednesday's outcome at all. It lands on the September and October contracts, and equity holders have to mark the entire curve in one afternoon. The committee walks in with a Crude Oil shock, a new duty schedule, initial claims at 187K and a chair who has told anyone listening that the 2% target is the whole of his mandate.
The week's data docket
Friday's preliminary Purchasing Managers Index readings set the table, with the composite at 53.6, services at 53.6 against 51 expected, and manufacturing at 53.8 against 54.5 expected and 53.9 prior. New home sales rose 1.6% MoM in June. Durable goods orders follow Monday at 12:30 GMT with the headline seen at 1.6% after a 4.5% decline, and consumer confidence lands Tuesday at 14:00 GMT.
The heaviest data arrives after the decision rather than before it, which leaves Wednesday's language to price a June inflation report the committee has seen and the market has not. Thursday at 12:30 GMT brings June core Personal Consumption Expenditures, seen at 0.1% MoM against 0.3% prior with headline running 4.1% YoY, alongside advance second-quarter Gross Domestic Product at 2.3% and initial claims at 206K. Friday adds the Employment Cost Index at 0.8% and the Michigan survey, where one-year inflation expectations sit at 4.2% and the five-year at 3.3%.
Resistance, support and bias
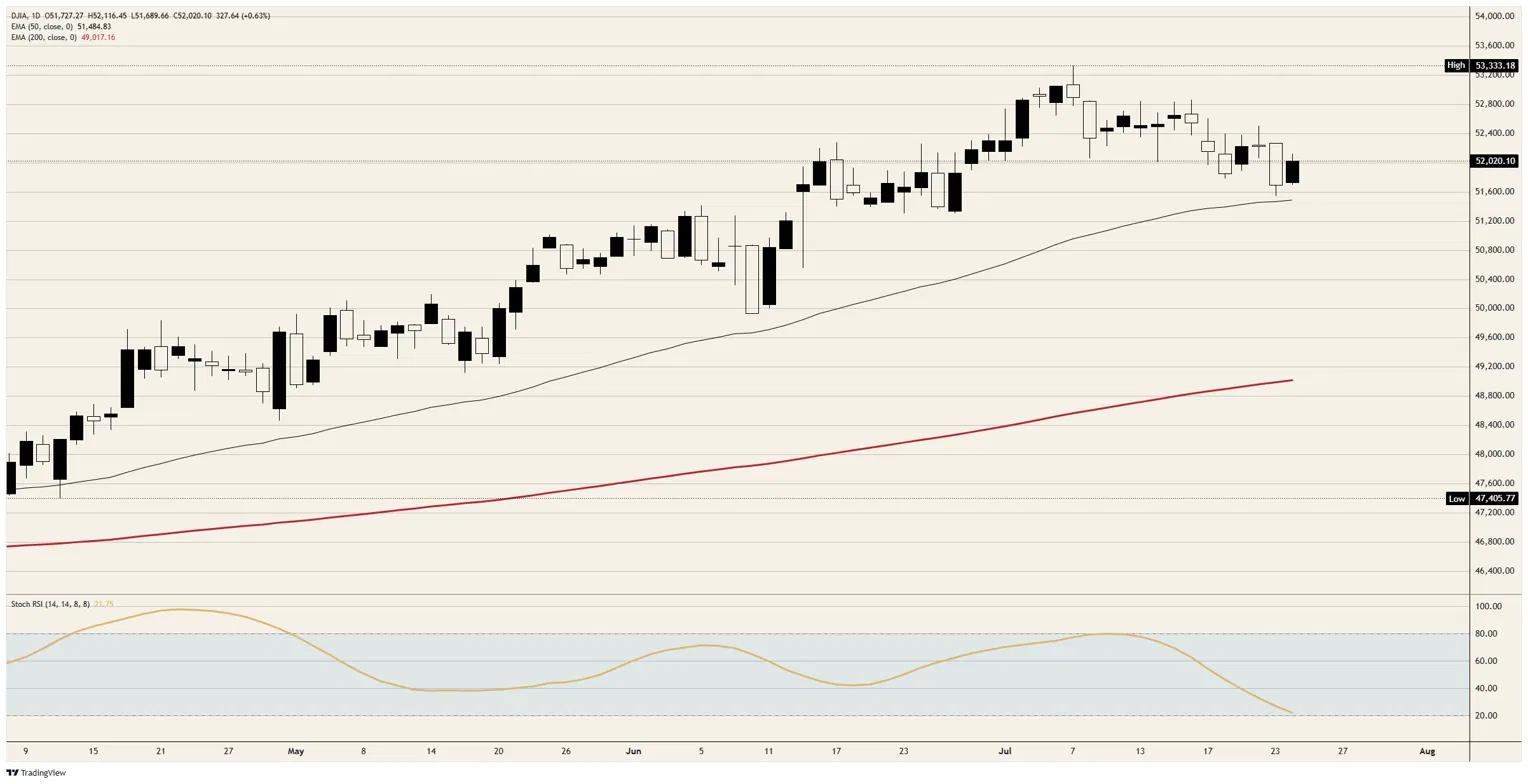
Resistance: The session high just above 52,100 is the first line, and the 52,200 area that capped every rally this week is the one that decides the next leg. Through there, 52,500 reopens the record just above 53,300.
Support: The 51,700 area holds Friday's low, with the week's floor near 51,800 sitting just beneath it. The 50-day Exponential Moving Average near 51,500 is the last defence of the summer trend, and the 200-day sits far below, just above 49,000.
Bias: Bearish below the 52,200 area. The daily Stochastic Relative Strength Index near 22 is falling toward oversold rather than turning up out of it, and Friday's bid rests on a report its own sources discount. Sell strength into 52,200 for a retest of 51,800 and then the 50-day. A daily close above 52,500 invalidates and puts the record back in play.
Dow Jones daily chart
Dow Jones FAQs
The Dow Jones Industrial Average, one of the oldest stock market indices in the world, is compiled of the 30 most traded stocks in the US. The index is price-weighted rather than weighted by capitalization. It is calculated by summing the prices of the constituent stocks and dividing them by a factor, currently 0.152. The index was founded by Charles Dow, who also founded the Wall Street Journal. In later years it has been criticized for not being broadly representative enough because it only tracks 30 conglomerates, unlike broader indices such as the S&P 500.
Many different factors drive the Dow Jones Industrial Average (DJIA). The aggregate performance of the component companies revealed in quarterly company earnings reports is the main one. US and global macroeconomic data also contributes as it impacts on investor sentiment. The level of interest rates, set by the Federal Reserve (Fed), also influences the DJIA as it affects the cost of credit, on which many corporations are heavily reliant. Therefore, inflation can be a major driver as well as other metrics which impact the Fed decisions.
Dow Theory is a method for identifying the primary trend of the stock market developed by Charles Dow. A key step is to compare the direction of the Dow Jones Industrial Average (DJIA) and the Dow Jones Transportation Average (DJTA) and only follow trends where both are moving in the same direction. Volume is a confirmatory criteria. The theory uses elements of peak and trough analysis. Dow’s theory posits three trend phases: accumulation, when smart money starts buying or selling; public participation, when the wider public joins in; and distribution, when the smart money exits.
There are a number of ways to trade the DJIA. One is to use ETFs which allow investors to trade the DJIA as a single security, rather than having to buy shares in all 30 constituent companies. A leading example is the SPDR Dow Jones Industrial Average ETF (DIA). DJIA futures contracts enable traders to speculate on the future value of the index and Options provide the right, but not the obligation, to buy or sell the index at a predetermined price in the future. Mutual funds enable investors to buy a share of a diversified portfolio of DJIA stocks thus providing exposure to the overall index.














