


What are Bollinger Bands?
Bollinger Bands, created by John Bollinger, are among the most popular technical indicator in trading. They are widely used in forex, stocks, commodities, and cryptocurrency markets because they can measure market volatility and identify trading opportunities. As a Bollinger Bands indicator, this tool adapts to price by expanding and contracting with volatility, making it a versatile part of many traders’ strategies.
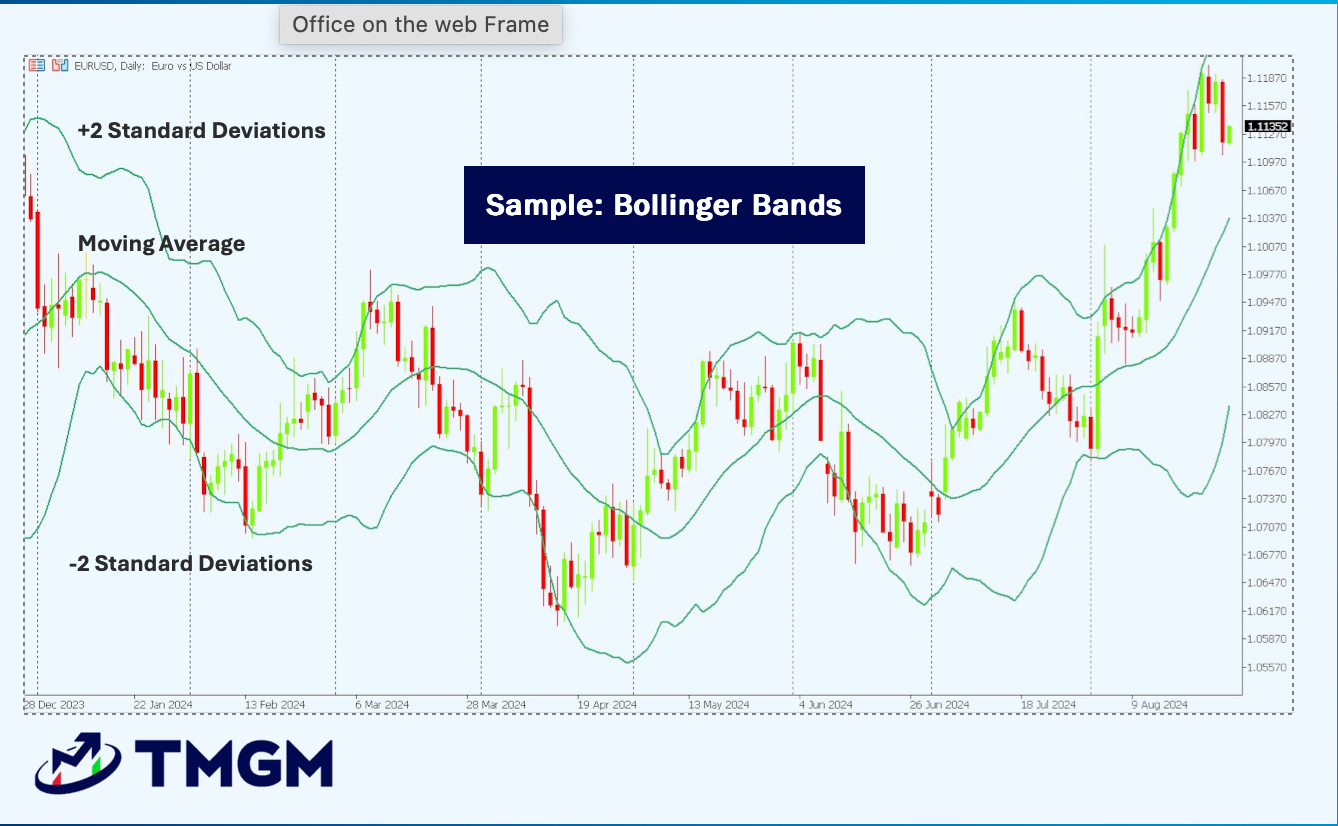
Key Components
Middle Band: A simple moving average (SMA) representing the market trend, typically set to 20 periods.
Upper Band: Plotted two standard deviations above the SMA, indicating potential overbought levels.
Lower Band: Plotted two standard deviations below the SMA, signaling potential oversold conditions.
These bands expand during high volatility and contract during low volatility, providing insights into market conditions.
How do Bollinger Bands Work?
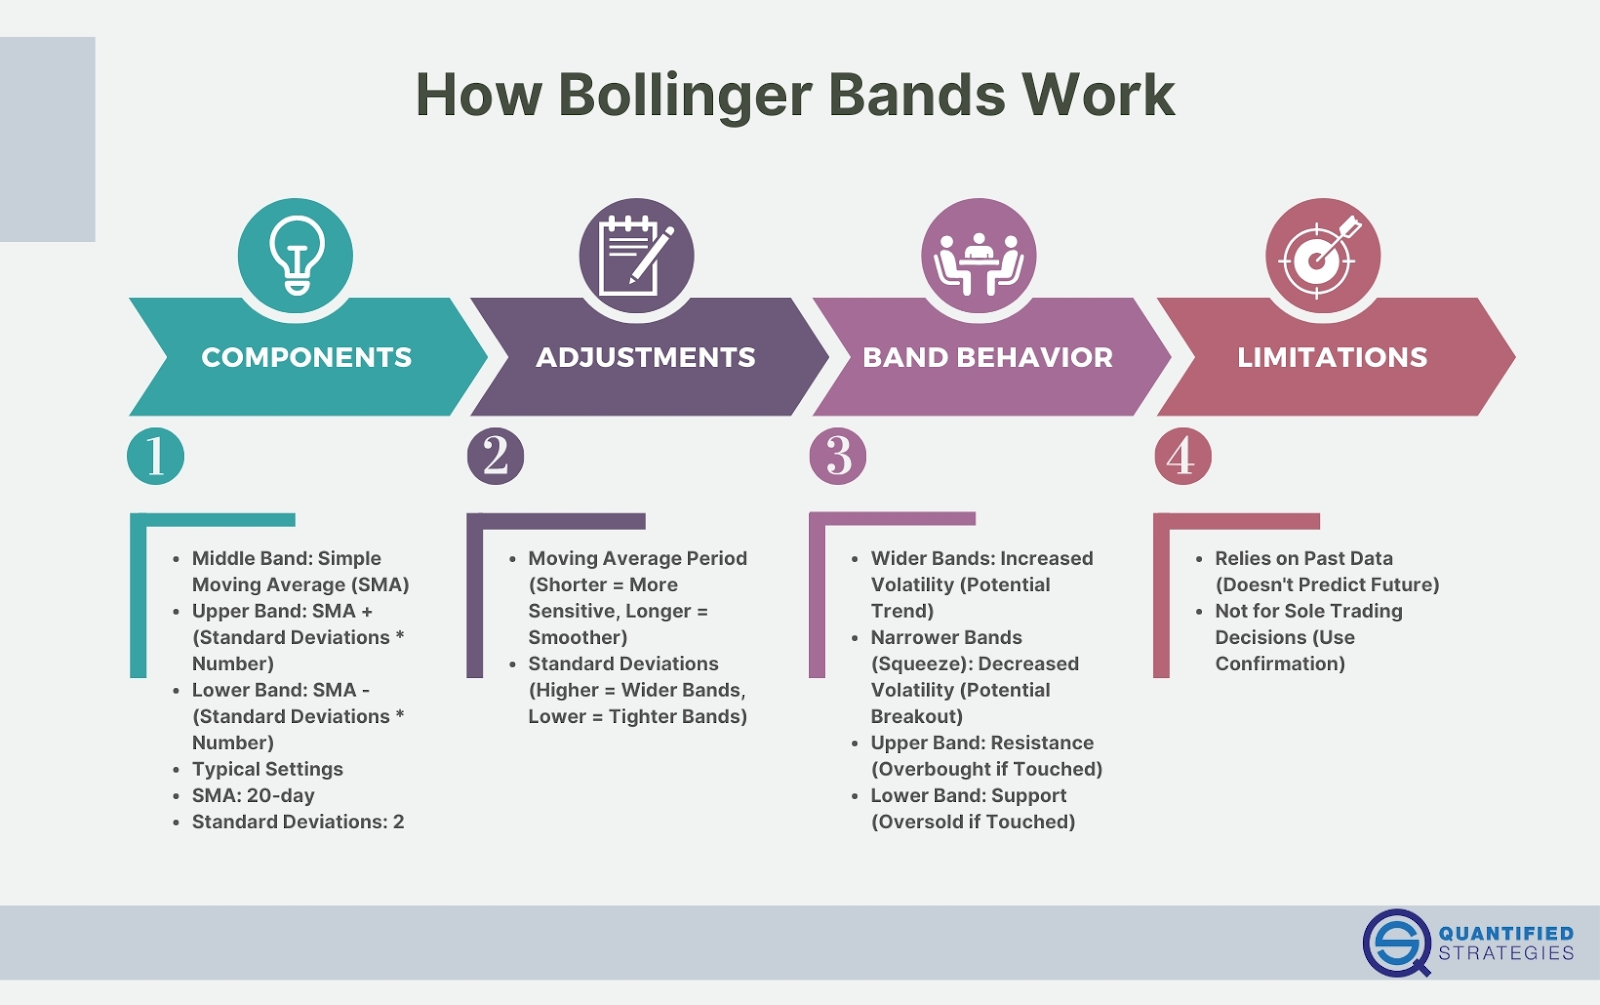
Volatility Indication
Wide bands indicate high volatility.
Narrow bands (a "squeeze") suggest low volatility and the potential for a breakout in day trading.
Dynamic Support and Resistance
The upper band acts as resistance, while the lower band supports. Prices nearing these bands can hint at reversals or trend continuations using confirmations from candlestick patterns or price actions.
Mean Reversion
Prices often revert to the middle band, offering opportunities for mean-reversion trades within swing trading.
Popular Bollinger Bands Strategies
Bollinger Band Squeeze (Breakout Strategy)
This strategy identifies periods of low volatility that often precede major price movements.
How It Works:
Observe the bands contracting into a tight range.
Enter a trade when the price breaks above or below the bands.
Entry:
Long Trade: Enter when the price closes above the upper band, confirmed by increased volume and trend-line breakouts.
Short Trade: Enter when the price closes below the lower band, with similar confirmation.
Risk Management:
Place stop-loss orders slightly outside the opposite band with a clear risk-reward ratio.
Use trailing stops to lock in profits.
Reversal at the Bands (Mean Reversion Strategy)
This approach targets reversals when prices touch or exceed the bands.
How It Works:
Overbought: Price touches the upper band and shows reversal signs.
Oversold: Price touches the lower band and hints at an upward reversal.
Entry:
Short Trade: Enter when the price touches the upper band and exhibits bearish signals.
Long Trade: Enter when the price touches the lower band with bullish signals.
Risk Management:
Stop-loss orders beyond the band.
Profit targets near the middle band.
Riding the Bands (Trend-Following Strategy)
Prices may "ride" the bands in strong trends, presenting opportunities for trend-following trades.
How It Works:
Uptrend: Price consistently touches the upper band and remains above the middle band.
Downtrend: Price continuously touches the lower band and stays below the middle band.
Entry:
Long Trade: Buy during an uptrend near the upper band.
Short Trade: Sell during a downtrend near the lower band.
Risk Management:
Trailing stop-losses to lock in profits.
Double Bottom at the Lower Band
A bullish reversal pattern that aligns well with Bollinger Bands.
How It Works:
The price touches the lower band, rebounds, and retests the band without a significant break.
Entry:
Enter after the second bottom forms, and the price moves above the middle band.
Risk Management:
Stop-loss below the second bottom.
Target profits near the upper band.
Bollinger Bands with RSI (Confirmation Strategy)
Combining Bollinger Bands with the Relative Strength Index (RSI) enhances accuracy by confirming overbought or oversold conditions using RSI thresholds.
How It Works:
Overbought: Price touches the upper band and RSI > 70.
Oversold: Price touches the lower band and RSI < 30.
Entry:
Align Bollinger Band signals with RSI thresholds.
Risk Management:
Use support/resistance levels to stop loss and take profit orders.
Tips for Using Bollinger Bands Effectively
Adjust Settings: Customize period and deviation settings for different assets and timeframes.
Combine Indicators: Pair Bollinger Bands with RSI, MACD , or candlestick patterns for confirmation.
Avoid False Breakouts: Wait for price action or volume confirmation.
Implement Risk Management: Always use stop-loss orders and position sizing.
Understand Market Context: Analyze trends and price action for optimal use.
Advantages
Adaptable across markets and timeframes.
Useful for spotting breakouts, trends, and reversals.
Works well with other indicators.
Disadvantages
Prone to false signals in choppy markets.
Requires confirmation for reliable trades.
Needs experience for effective interpretation.
Bollinger Bands are a versatile tool for analyzing market conditions and identifying trading opportunities. By mastering strategies like the Bollinger Band Squeeze, Mean Reversion, and Trend-Following, traders can leverage this powerful indicator for success.
Combining Bollinger Bands with other tools and employing sound risk management can enhance trading results.
Take your trading to the next level! Open a TMGM trading or demo account and access advanced tools, competitive spreads, and seamless execution.


